
Figure 4
- ID
- ZDB-FIG-231205-4
- Publication
- Wilcockson et al., 2023 - An improved Erk biosensor detects oscillatory Erk dynamics driven by mitotic erasure during early development
- Other Figures
- All Figure Page
- Back to All Figure Page
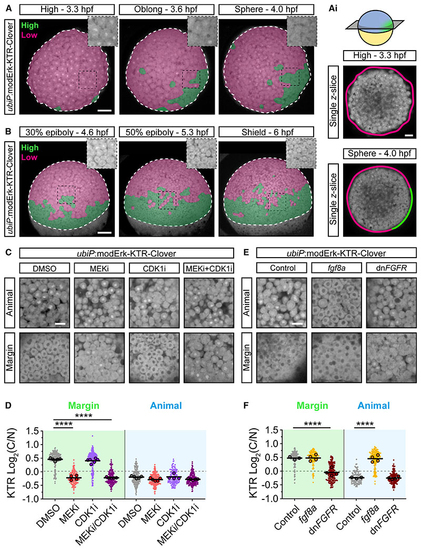
modErk-KTR specifically reports on Fgf/Erk activity in early zebrafish embryos (A and B) Stills of live (Ai) Single (C) Live imaging of (D) Quantification of Erk activity in (C) at the margin and animally. Shown are the single-cell readouts of Erk activity overlayed with the per embryo averages and the overall mean for DMSO (control, n = 209 cells from 5 embryos [margin] or n = 200 cells from 5 embryos [animal]), 10 μM PD-0325901 (MEKi; n = 137 cells from 4 embryos [margin] or n = 196 from 5 embryos [animal]), 20 μM RO-3306 (CDK1i; n = 227 cells from 6 embryos [margin] or n = 133 cells from 4 embryos [animal]) or both 10 μM PD-0325901 and 20 μM RO-3306 (MEKi + CDK1i; n = 183 cells from 5 embryos [margin] or n = 194 cells from 5 embryos [animal]) treated embryos. (E) Live imaging as in (C) of embryos injected with either 25 pg (F) Quantification of Erk activity in (E) as in (D) for control (n = 142 cells from 3 embryos [margin] and n = 116 cells from 3 embryos [animal]), Statistical tests were one-way ANOVA with Šidák’s multiple comparisons test. Scale bars, 100 μm (A and B), 50 μm (Ai) or 20 μm (C–E); **** p > 0.0001. See also |
Reprinted from Developmental Cell, 58(23), Wilcockson, S.G., Guglielmi, L., Araguas Rodriguez, P., Amoyel, M., Hill, C.S., An improved Erk biosensor detects oscillatory Erk dynamics driven by mitotic erasure during early development, 2802-2818.e5, Copyright (2023) with permission from Elsevier. Full text @ Dev. Cell