
Figure 6
- ID
- ZDB-FIG-231205-6
- Publication
- Wilcockson et al., 2023 - An improved Erk biosensor detects oscillatory Erk dynamics driven by mitotic erasure during early development
- Other Figures
- All Figure Page
- Back to All Figure Page
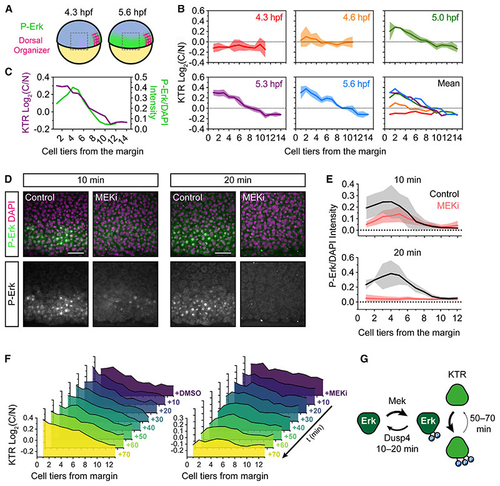
modERK-KTR reads out Fgf/Erk signaling gradient formation in real time (A) Schematic of the zebrafish embryo illustrating the lateral region imaged in (B) relative to the dorsal organizer (see (B) Quantification of Erk activity (log2(C/N)) in the lateral region of (C) Overlay of the mean Erk activity (modErk-KTR) and P-Erk levels in similarly staged embryos (5.3 hpf). (D) Representative immunofluorescence images of embryos treated with DMSO (control) or MEKi (10 μM PD-0325901) for 10–20 min from 5.0 hpf before fixation. (E) Quantification of P-Erk levels from (D) in cell tiers relative to the embryo margin (0) showing mean ± SD. DMSO 10 min, 5 embryos; MEKi 10 min, n = 6 embryos; DMSO 20 min, n = 4 embryos; MEKi 20 min, n = 4 embryos. (F) Quantification of modErk-KTR read out following treatment with DMSO (control) or 10 μM PD-0325901 (MEKi). Shown is the mean of n = 3 embryos per time point. (G) Schematic comparing the dephosphorylation rates of Erk and its targets. Scale bars, 50 μm. See also |
Reprinted from Developmental Cell, 58(23), Wilcockson, S.G., Guglielmi, L., Araguas Rodriguez, P., Amoyel, M., Hill, C.S., An improved Erk biosensor detects oscillatory Erk dynamics driven by mitotic erasure during early development, 2802-2818.e5, Copyright (2023) with permission from Elsevier. Full text @ Dev. Cell