
Figure 2
- ID
- ZDB-FIG-231205-2
- Publication
- Wilcockson et al., 2023 - An improved Erk biosensor detects oscillatory Erk dynamics driven by mitotic erasure during early development
- Other Figures
- All Figure Page
- Back to All Figure Page
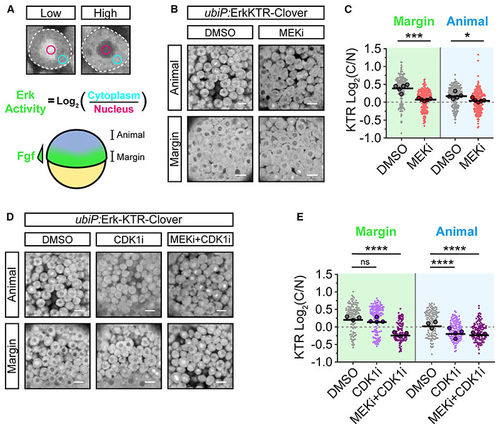
Erk-KTR reports on Erk and Cdk1 activity in early zebrafish embryos (A) Illustration of the method used to report Erk-KTR activity in early zebrafish embryos (schematized below) by measuring mean fluorescence intensity in a region of the nucleus (magenta) and cytoplasm (cyan). The margin of the embryo exhibits high Fgf signaling, while the animal pole does not. (B) Live imaging of (C) Quantification of Erk-KTR activity in (B) at the margin (***p = 0.0002) and animally(*p = 0.0207). n = 178–209 cells per condition from 5 embryos. Shown arethe single-cell readouts of Erk-KTR activity overlayed with the per embryo averages and the overall mean. (D) As in (B) but following treatment with DMSO (control), 20 μM RO-3306 (CDK1i), or both 10 μM PD-0325901 and 20 μM RO-3306 (MEKi + CDK1i) for 1 h from 4.0 hpf. (E) Quantification of Erk-KTR activity in (D) as in (C) for CDK1i (margin p = 0.3131; animal p < 0.0001) or both MEKi and CDK1i (margin p < 0.0001; animal p < 0.0001). n = 107–146 cells per condition from 3 (DMSO and MEKi + CDK1i) or 4 embryos (CDK1i) per condition. Statistical tests were Student t test (C) or one-way ANOVA with Sidak’s multiple comparisons test (E). Scale bars, 20 μm; **** p < 0.0001; ns, not significant. |
Reprinted from Developmental Cell, 58(23), Wilcockson, S.G., Guglielmi, L., Araguas Rodriguez, P., Amoyel, M., Hill, C.S., An improved Erk biosensor detects oscillatory Erk dynamics driven by mitotic erasure during early development, 2802-2818.e5, Copyright (2023) with permission from Elsevier. Full text @ Dev. Cell