FIGURE SUMMARY
Title

Matriptase-dependent epidermal pre-neoplasm in zebrafish embryos caused by a combination of hypotonic stress and epithelial polarity defects

Authors
Hatzold, J., Nett, V., Brantsch, S., Zhang, J.L., Armistead, J., Wessendorf, H., Stephens, R., Humbert, P.O., Iden, S., Hammerschmidt, M.
Source
Full text @ PLoS Genet.

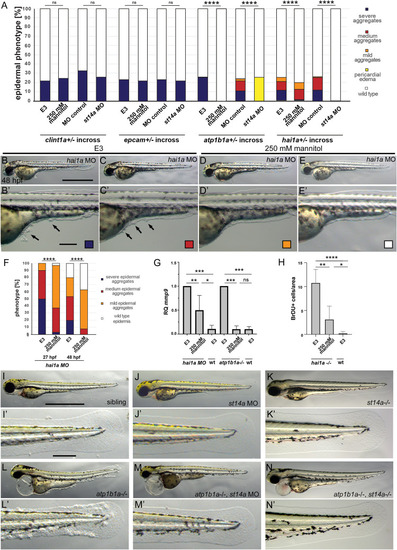
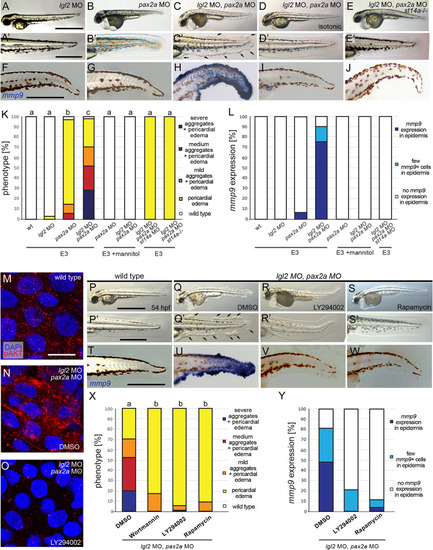
Hypotonic stress and Matriptase-1a function are required for the epidermal phenotype of hai1a and atp1b1a, but not clint1 and epcam mutants.

(A-H) Isotonic medium attenuates the phenotype of hai1a-/- mutants and rescues the phenotype of atp1b1a-/- mutants, but has no effect of clint1-/- or epcam-/- mutants. (A) Quantification of epidermal phenotypes of 48 hpf embryos obtained from parents heterozygous for the mutations clint1hi1520 [22], epcamhi2151 [42], atp1b1am14 [26], or hai1ahi2217 [21], raised in E3, E3 + 250 mM Mannitol, or injected with control morpholino or st14a morpholino (n = 59–102 from N = 3 independent clutches per condition, Significances were determined via a Chi-square test, ns, not significantly different (p>0.05); ****, significantly different (p< 0.0001)). (B-E’) Brightfield images of live 48 hpf hai1a morphants raised in E3 (B,B’,C,C’) or E3 + 250 mM Mannitol (D,D’,E,E’) as lateral overviews of entire embroys (A-D) or magnified lateral views of the yolk tube and yolk extension regions of the same embryos (A’-D’); arrows in (B’,C’) point to epidermal aggregates on yolk sac and ventral median fin fold. (F) Quantification of phenotypic classes (n = 27–67) of hai1a morphant embryos raised in E3 or E3 + 250 mM Mannitol, representatives of which are shown in panels (B-E’) Significances were determined via a Chi-square test, ns, not significantly different (p>0.05); ****, significantly different (p< 0.0001). (G) RT-qPCR showing relative quantities of mmp9 transcript of 48 hpf hai1a morphant or 56 hpf atp1b1a mutant embryos raised in E3 or E3 + 250 mM Mannitol, compared to their respective siblings. cDNA was obtained from pools of 15 embryos each, N = 3 for hai1a, N = 3 for atp1b1a. H. Quantification of BrdU-labeled nuclei in defined, equally-sized areas of the fin fold of wild types and hai1a-/- mutants at 48 hpf, raised in E3 or E3 + 250 mM Mannitol, n = 4–6. Significances in G and H were determined via a one-way ANOVA and Tukey’s post hoc test; ns, not significantly different (p>0.05); *,**,***,****, significantly different (p<0.05, 0.01, 0.001, 0.0001, respectively). (A,I–N’) Loss of st14a function rescues epidermal aggregate formation in atp1b1a-/- mutants. Brightfield images of representative live 72 hpf embryos, either as lateral overviews of the entire embryos (I-N), or as magnified lateral views of the tail of the same embryos (I’-N’): wild-type sibling (I,I’), wild-type sibling injected with st14a MO (J,J’), st14a-/- mutant (K,K’), atp1b1a -/- mutant with epidermal aggregates (L,L’), atp1b1a -/- mutant injected with st14a MO (M,M’), and atp1b1a-/-; st14a-/- double mutant (N,N’), both with wild-type-appearing epidermis. For quantifications, see (A) and S1I Fig. Scale bars: 500 μm (B,I), 100 μm (B’,I’).

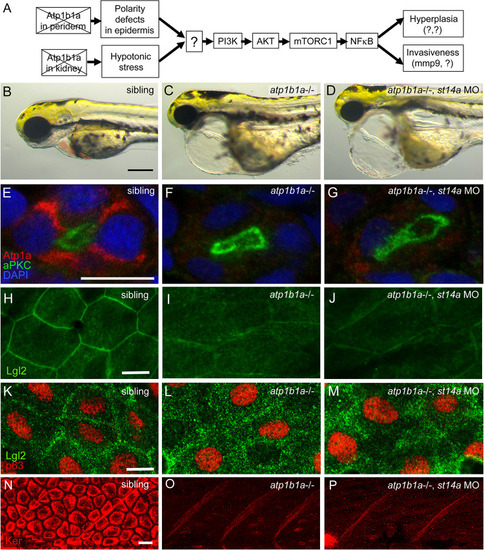
Matriptase-1 functions downstream of epidermal polarity defects and hypotonic stress induced by loss of ATP1b1a.

(A) Schematic of the previously [26] identified tumorigenic pathway activated in basal keratinocytes downstream of ATP1b1a loss. (B-D) Live brightfield images of 72 hpf embryos displaying pericardial edema both in atp1b1a mutants (D) and atp1b1a mutants injected with st14a MO (E) but epidermal aggregates only in atp1b1a mutants. (E-G) Immunofluorescence for Atp1a and aPKC on cross-sections of 54 hpf atp1b1a sibling (E), atp1b1a mutant (F), and atp1b1a mutant injected with st14a MO (G) showing absence of Na+,K+-ATPase on the basolateral sides of epithelial cells of the pronephric ducts (apically labelled by aPKC) in both atp1b1a-/- and atp1b1a-/-, st14a MO (N = 3, n = 23–36). (H-M) Immunofluorescence for Lgl2 (green) and p63 (red) on whole mounts of 54 hpf atp1b1a sibling (H, peridermal layer, K, basal layer), atp1b1a mutant (I, peridermal layer, L, basal layer), and atp1b1a mutant injected with st14a MO (J, peridermal layer, M, basal layer), lateral views on trunk regions (N = 3, n = 35–41). (N-P) Immunofluorescence for panKeratin (Ker, red), on whole mounts of 84 hpf atp1b1a sibling (N), atp1b1a mutant (O), and atp1b1a mutant injected with st14a MO (P), lateral views on trunk regions (N = 3, n = 24–28). Scale bars: 100 μm (B), 10 μm (E,H,K,N).

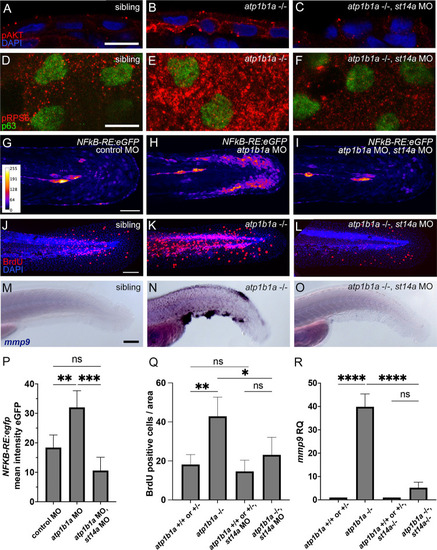
Matriptase-1 functions upstream of PI3K-AKT-mTORC1-NFkB to induce hyperproliferation and partial EMT.

(A-C) Immunofluorescence on cross-sections of 54 hpf atp1b1a sibling (A), atp1b1a mutant (B), and atp1b1a mutant injected with st14a MO (C) showing pAKT (red) in basal cells in atp1b1a-/- but not in atp1b1a-/-, st14a MO (N = 3, n = 41–46). (D-F) Immunofluorescence on whole mounts, lateral views on trunk region for pRPS6 (red) and tp63 (green) in 54 hpf atp1b1a sibling (D), atp1b1a mutant (E), and atp1b1a mutant injected with st14a MO (F) (N = 3, n = 27–32). (G-I) Confocal images of the tail region of live 54 hpf embryos transgenic for NFkB-RE:eGFP injected with control MO (G), injected with atp1b1a MO (H) or co-injected with atp1b1a and st14a MO (I). Intensity of the GFP signal is color-coded. (J-L) Immunofluorescence of BrdU incorporation (red) of 56 hpf wild-type sibling (J), atp1b1a mutant (K), and atp1b1a mutant injected with st14a MO (L). (M-O) Whole mount in situ hybridization of mmp9 in 58 hpf wild-type sibling (M), atp1b1a mutant (N), or atp1b1a mutant injected with st14a MO (O) (N = 2, n = 18–24). (P) Quantification of GFP signal obtained from the fin fold region of embryos as shown in (G-I) (n = 3–5). (Q) Quantification of BrdU-positive cells in the fin fold area (n = 3–5). (R) RT-qPCR showing relative quantities of mmp9 transcript of 58 hpf atp1b1a-/- mutants in comparison to their atp1b1a+/+ and atp1b1a+/- siblings, either containing (bars 1+2) or lacking (st14a-/-; bars 3+4) functional Matriptase-1 (cDNA obtained from 15 pooled embryos each, N = 3). Significances in (P-R) were determined via a one-way ANOVA and Tukey’s post hoc test; ns, not significantly different (p>0.05); *,**,***,**** significantly different with p<0.05, p<0.01, p<0.001, p<0.0001, respectively. Scale bars: 10 μm (A,D,G,J,M).

Matriptase activity is increased by hypotonicity and polarity defects.

(A-B) RT-qPCR showing no significant change of st14a and hai1a transcript levels in atp1b1a mutants compared to their siblings (n = 3, cDNA obtained from pools of 15 embryos each at 56 hpf, significances were determined via Student’s t-test; ns, non-significant difference; p>0.05). (C-E) Reporter assay for Matriptase activity towards Par2 cleavage showing that zebrafish Matriptase1a cleaves AP-Par2b more efficiently at lower osmolalities. HEK293 cells were transfected with empty pcDNA3, pcDNA3+AP-Par2b, and pcDNA3+St14a. After 24 hrs in regular / isotonic medium (tonicity of 320 mOsm), cells were exposed to media of 320 mOsm, 270 mOsm, 230 mOsm, and 150 mOsm for 15 and 45 minutes, respectively. (C) At 15 min, absolute luminescence values of AP released into the supernatant progressively increase with increasing hypotonicity / lower tonicity. (D,E) Ratios of luminescence between isotonic and hypotonic media indicate an up to 3.79-fold increase (in 150 mOsm medium) after 15 min (D) and a 2.51-fold increase after 45 min (E). Ratios were determined from values as shown in (C), deducting baseline luminescence (bar 1 in C) from the luminenscences of co-transfected samples obtained at different osmolarities (bars 3–6 in C), normalized against the value at 320 mOsm (isotonic); n = 5, significances were determined via a one-way ANOVA and Tukey’s post hoc test; columns with same superscript letter (a,b,c) are not significantly different (p>0.05). (F) Immunoblot analysis for processed / activated Matriptase-1 (ST14) showing that culturing of MCF-10A cells for 24 hours in hypotonic medium (150 mOsm) leads to a 3.78-fold increase in active endogenous Matriptase-1 compared to cells cultured in isotonic medium (320 Osm). Bar diagram displays mean value of proteins normalized to loading control GAPDH (n = 3); ns, not significantly different (p>0.05); **, ***, significantly different with p<0.01, p<0.001, respectively. (G-H) Scribble knockout (SCRIB KO) in human MCF-10A cells does not affect protein levels of full length ST14 or HAI1. Representative western blots show unaltered amounts of endogenous full-length ST14 (G) and HAI1 (H) proteins in SCRIB-KO cells compared to knockout cells with re-introduced Scribble (SCRIB KO + SCRIB), cultured in media of 320 mOsm, 230 mOsm, or 150 mOsm for 1 hr. Bar diagrams display mean value of proteins normalized to loading control GAPDH (n = 2); all differences are not statistically significant (p>0.05). (I) Loss of Scribble increases active ST14 in media of different osmolalities. Representative western blots showing active ST14 and GAPDH of SCRIB-KO and SCRIB-KO + SCRIB cells cultured in media of 320 mOsm, 230 mOsm, and 150 mOsm for 24 hrs, with highest numbers in cells lacking the epithelial polarity protein Scribble protein and exposed to hypotonic stress. Bar diagram displays mean value of proteins normalized to loading control GAPDH (n = 3). Significances were determined via a one-way ANOVA and Tukey’s post hoc test; columns with same superscript letter (a,b,c,d) are not significantly different (p>0.05).

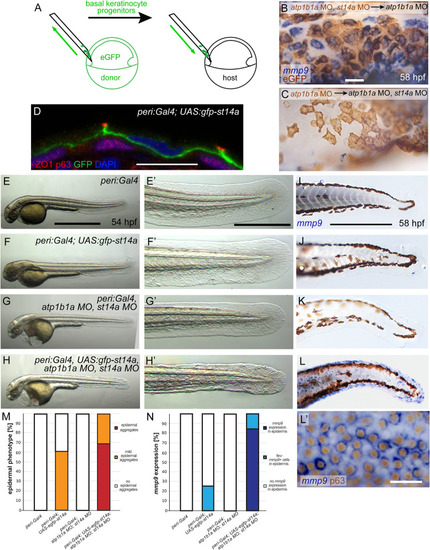
St14a functions in the periderm to activate signaling in the underlying basal layer.

(A-C) Loss of st14a in basal cells is neither necessary nor sufficient to normalize mmp9 expression in basal cells of atp1b1a morphants. (A) Schematic of experimental set up in which ventral ectodermal cells either from atp1b1a, st14a double morphant or atp1b1a morphant donors were homotopically transplanted at 6 hpf into the same region of atp1b1a or atp1b1a, st14a double morphant hosts, respectively (atp1b1a MO, st14a MO>atp1b1a MO or atp1b1a MO>atp1b1a MO, st14a MO). Donor cells express Tg(Ola.Actb:Hsa.hras-egfp)-encoded membrane-tagged eGFP. Whole mount in situ hybridization for mmp9 (blue) and immunohistochemistry for eGFP (brown) of chimeric embryos at 58 hpf, showing that in atp1b1a MO, st14a MO>atp1b1a MO experiments, atp1b1a MO, st14a MO basal cells express mmp9 (B), and are thus not rescued although they lack functional Matriptase-1; whereas in atp1b1a MO>atp1b1a MO, st14aMO experiments, atp1b1a MO basal cells lack mmp9 expression (C), and are thus rescued although they contain Matriptase-1 (n = 6–8). (D-N) Re-introduction of st14a into peridermal cells of atp1b1a, st14a double morphants abrogates the rescue of basal cells, reflected by re-gained epidermal aggregate formation and enhanced mmp9 expression. (D) Immunofluorescence for eGFP-Matriptase1a (green), p63 as a nuclear marker for basal cells (red) and ZO1/Tjp1 as a marker for tight junctions in peridermal cells (red) on transverse section through the epidermis of a 48 hpf embryo transgenic for peri:Gal4zc1044a and UAS:gfp-st14afr58Tg, counterstained with DAPI (blue). Transgene-encoded Matriptase-1 is restricted to peridermal cells and localized at their basolateral membranes. (E-H’) Brightfield images of representative live 56 hpf embryos transgenic for peri:Gal4zc1044a or peri:Gal4zc1044a; UAS:eGFP-st14a controls (E,F) and injected with atp1b1a and st14a morpholinos (atp1b1a MO, st14a MO) (G,H); lateral views of entire embryos (E-H), and magnified views of tail region of same embryos (E’-H’). In contrast to atp1b1a MO, st14a MO embryos without transgenic re-introduction of st14a (G,G’), the atp1b1a MO, st14a MO embryos transgenic for peri:Gal4zc1044a; UAS:eGFP-st14a displays epidermal aggregates (H,H’), comparable to global atp1b1a single mutants (compare with Fig 1L’). (I-L’) Representative whole mount mmp9 in situ hybridizations, revealing re-gained strong mmp9 expression in basal cells of 72 hpf atp1b1a MO, st14a MO embryo transgenic for peri:Gal4zc1044a; UAS:eGFP-st14a (L,L’, the latter counterstained for the basal cell marker p63), but not in the atp1b1a MO, st14a MO embryos lacking transgene-driven peridermal st14a re-expression (K). (M) Quantification of epidermal phenotype of 56 hpf embryos with respective genotypes, as shown in (E-H) (n = 20–46). (N) Quantification of mmp9 in situ signal of 72 hpf embryos with respective genotypes, as shown in (I-L) (n = 12–38). Scale bars: 20 μm (B,L’), 10 μm (D), 500 μm (E), 100 μm (E‘,I).

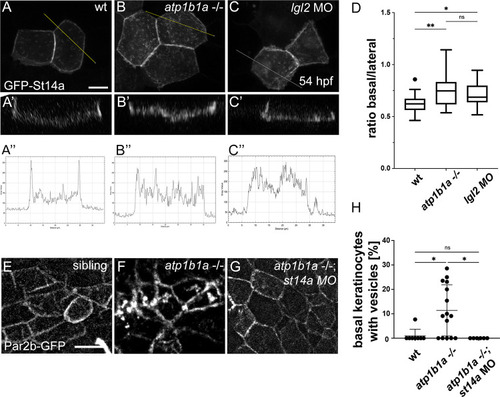
Epithelial polarity defects lead to altered distribution of Matriptase-1 within the basolateral domain of peridermal cells and of Par2b in basal cells.

(A-D) atp1b1a mutants and lgl2 morphants display a shift of eGFP-St14a from lateral towards basal sides of peridermal cell membranes. (A-C’) Live confocal z-stack images of eGFP-St14a in peridermal cells of 48 hpf, krt4:egfp-st14a-injected wild-type (A), atp1b1a-/- (B), and lgl2 MO (C) embryos, presented as sum slices projections (A-C) and orthogonal views (A’-C’); scale bar: 10 μm. (A”-C”) Grey values obtained from the plot profile of yellow lines crossing cells in A-C. (D) Quantification of the ratio of the mean intensity of basally versus laterally localized eGPF (n = 15–30; significances were determined via a one-way ANOVA and Tukey’s post hoc test; ns, not significantly different (p>0.05); *,**, significantly different with p<0.05, p<0.01, respectively). (E-H). Basal cells of atp1b1a mutants display st14a-dependent localization of Par2b-eGFP in intracellular vesicles. Maximal intensity projections of live confocal z-stacks of basal cells in the fin fold region in wild-type siblings (E), atp1b1a mutants (F), and atp1b1a mutants injected with st14a MO (G), all transgenic for Tg(ΔNp63:par2b-egfp)fr59Tg; scale bar: 20 μm. All embryos display Par2b-GFP at the lateral membranes of basal keratinocytes. The wild-type sibling and st14a-deficient atp1b1a mutant display a rather homogeneous faint staining in the “interior” of cells (E,G), which might represent Par2b-GFP at the apical cell membranes, and which is even weaker in the atp1b1a mutant (F). On the other hand, some, but not all, basal keratinocytes of the atp1b1a mutant contain larger and roundish intracellular Par2b-GFP-positive structures (F), which might represent vesicles and which are absent from the wild-type and st14a-deficient atp1b1a mutant embryo (E,G). (H), Quantification of basal cells containing GFP-positive vesicle-like figures per embryo (n = 6–15 embryos; significances were determined via a one-way ANOVA and Tukey’s post hoc test; ns, not significantly different (p>0.05); *, significantly different (p<0.05)).

Polarity defects combined with hypotonic stress cause aberrant activation of the Matriptase-PI3K-pAKT-mTORC1 pathway and pre-neoplastic transformations of basal keratinocytes in the embryonic zebrafish epidermis.

(A-E’) Brightfield images of live 54 hpf embryos morphant for lgl2 to induce polarity defects, morphant for pax2a to induce hypotonic stress, or morphant for both lgl2 and pax2a; overviews of entire embryos (A-E) and magnified views of tail regions (A’-E’). Whereas lgl2 (A,A’) and pax2a knockdown (B,B’) alone do not result in epidermal defects, the combination of both causes epidermal aggregate formation (C,C’; indicated in C’ with arrows), which is abrogated by isotonic conditions (D,D’, raised in E3 + 250 mM Mannitol) or in st14a mutants (E,E’). Scale bar: 500 μm in overview, 100 μm in magnified image. (F-J) Whole mount in situ hybridization for mmp9 transcripts showing mmp9 expression only in pax2a, lgl2 double morphant embryos raised in hypotonic conditions (H) but not in single morphants (F,G), or double morphants raised in isotonic conditions (I) or in a st14a mutant background (J). Scale bar: 100 μm. (K) Quantification of phenotypes of embryos with different genotypes / morphant conditions under hypotonic (E3) and isotonic (E3 + 250 mM Mannitol) conditions (N = 2–4, n = 22–106; significances were determined via a one-way ANOVA and Tukey’s post hoc test by comparing fraction of embryos displaying an epidermal phenotype (mild, medium, and strong) with no epidermal phenotype; columns with same superscript letter (a,b,c) are not significantly different (p>0.05).). (L) Quantification of embryos with different morphant conditions under hypotonic (E3) and isotonic (E3 + 250 mM Mannitol) conditions displaying strong mmp9 expression, few mmp9 positive cells, or no mmp9 expression in the epidermis (n = 30–41). (M-O) Immunofluorescence for pAKT on whole mounts, lateral views on trunk regions, showing increased pAKT levels in basal keratinocytes in 54 hpf lgl2, pax2a double morphants (N) compared to wild-type embryo (M) or lgl2, pax2a double morphants treated with the PI3K inhibitor LY294002 (n = 12–15). (O). Scale bar: 10 μm. (P-S’) Bright field images of live 54 hpf lgl2, pax2a, double morphant embryos as overviews of entire embryos (P-S) or magnified views of tail regions (P’-S’), showing aggregate formation in the DMSO control (Q,Q; indicated in Q’ by arrows’), which is abolished by treating with 25 μM LY294002 (R, R’) or 1.1 μM Rapamycin (S,S’). Scale bar: 500 μm in overview, 100 μm in magnified image. (T-W). Whole mount in situ hybridization for mmp9 transcripts showing mmp9 upregulation in 58 hpf pax2a, lgl2 double morphant in the DMSO control (U) but no mmp9 expression in wild type (T), or in LY294002 (V) or Rapamycin (W) treated lgl2, pax2a double morphant. Scale bar: 100 μm. (X) Quantification of epidermal aggregates and pericardial edema phenotypes in embryos, representatives of which are shown in (P-S’) (n = 17–34 embryos per condition from N = 3–5 independent experiments, Significances were determined via a one-way ANOVA and Tukey’s post hoc test by comparing fraction of embryos displaying an epidermal phenotype (mild, medium, and strong) with no epidermal phenotype; columns with same superscript letter (a,b,c) are not significantly different (p>0.001).)).). (X) Quantification of embryos with widespread, scarce or no mmp9 expression in the epidermis, representatives of which are shown in (T-W) (n = 26–29 embryos per condition from N = 3 independent experiments).

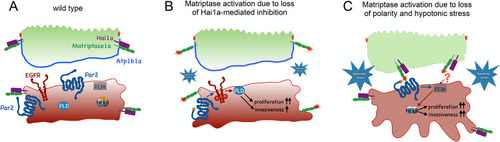
Proposed mechanisms underlying the differential activations and oncogenic activities of Matriptase-1 in hai1a and atp1b1a mutants to induce cell proliferation, EMT and invasiveness.

(A) Model of Matriptase activity restriction in the wild-type zebrafish epidermis. Hai1a is tightly associated with Matriptase, thereby inhibiting its activity, both in peridermal and basal cells. In addition, Matriptase trans-layer signaling from the periderm to the basal layer is restrained by confined levels of Matriptase at the basal side of peridermal cells. (B) Upon loss of Hai1a, Matriptase 1 is no longer inhibited (red star), leading to the cleavage of adjacent Par2b (orange asterisk), which in turn activates the EGFR-PLD pathway, to induce hyperproliferation and expression of mmp9 (a marker for EMT). Mild hypotonicity (small blue star), most likely due to compromised epidermal integrity, further enhances Matriptase activity levels. Note that additional pathways downstream of Par2b have been described, which lead to additional pre-neoplastic events, like sterile inflammation; however, they do not include PI3K [23]. (C) More extreme hypotonicity in the pericellular space (due to loss of ATP1b1a or Pax2a; large blue star) causes (moderate) Matriptase activation even in the presence of Hai1a. This, however, only has subtle effects on epidermal cells (Fig 7K,7L), unless occurring in conjunction with the loss of epithelial polarity (due to loss of ATP1b1a or Lgl2), allowing Matriptase to shift towards the basal side of peridermal cells, thereby getting into physical contact and to cleave / activate Par2b and other, not yet identified targets (indicated by?) on underlying basal keratinocytes in trans. These targets activate a PI3K-pAKT-mTORC1-NFkB pathway in basal cells resulting in pre-neoplastic events like hyperproliferation, EMT and, in contrast to hai1a mutants, strong invasiveness of basal cells.

Acknowledgments
This image is the copyrighted work of the attributed author or publisher, and ZFIN has permission only to display this image to its users. Additional permissions should be obtained from the applicable author or publisher of the image. Full text @ PLoS Genet.