IMAGE

Fig 2

ID
ZDB-IMAGE-230825-16
Source
Figures for Hatzold et al., 2023
Image
Figure Caption

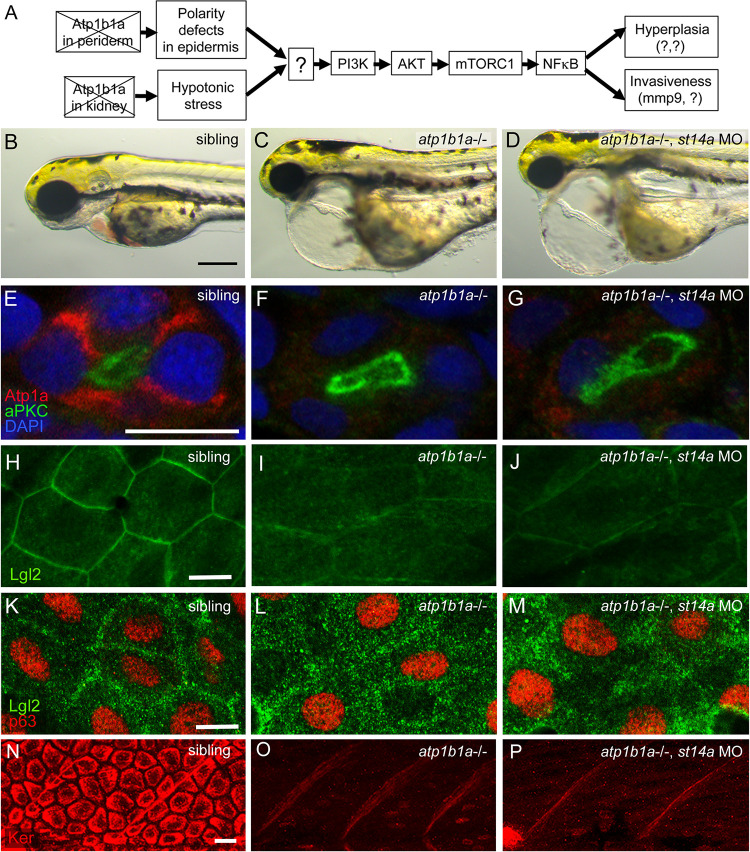
Fig 2 Matriptase-1 functions downstream of epidermal polarity defects and hypotonic stress induced by loss of ATP1b1a.

(A) Schematic of the previously [26] identified tumorigenic pathway activated in basal keratinocytes downstream of ATP1b1a loss. (B-D) Live brightfield images of 72 hpf embryos displaying pericardial edema both in atp1b1a mutants (D) and atp1b1a mutants injected with st14a MO (E) but epidermal aggregates only in atp1b1a mutants. (E-G) Immunofluorescence for Atp1a and aPKC on cross-sections of 54 hpf atp1b1a sibling (E), atp1b1a mutant (F), and atp1b1a mutant injected with st14a MO (G) showing absence of Na+,K+-ATPase on the basolateral sides of epithelial cells of the pronephric ducts (apically labelled by aPKC) in both atp1b1a-/- and atp1b1a-/-, st14a MO (N = 3, n = 23–36). (H-M) Immunofluorescence for Lgl2 (green) and p63 (red) on whole mounts of 54 hpf atp1b1a sibling (H, peridermal layer, K, basal layer), atp1b1a mutant (I, peridermal layer, L, basal layer), and atp1b1a mutant injected with st14a MO (J, peridermal layer, M, basal layer), lateral views on trunk regions (N = 3, n = 35–41). (N-P) Immunofluorescence for panKeratin (Ker, red), on whole mounts of 84 hpf atp1b1a sibling (N), atp1b1a mutant (O), and atp1b1a mutant injected with st14a MO (P), lateral views on trunk regions (N = 3, n = 24–28). Scale bars: 100 μm (B), 10 μm (E,H,K,N).

Acknowledgments
This image is the copyrighted work of the attributed author or publisher, and ZFIN has permission only to display this image to its users. Additional permissions should be obtained from the applicable author or publisher of the image. Full text @ PLoS Genet.