|
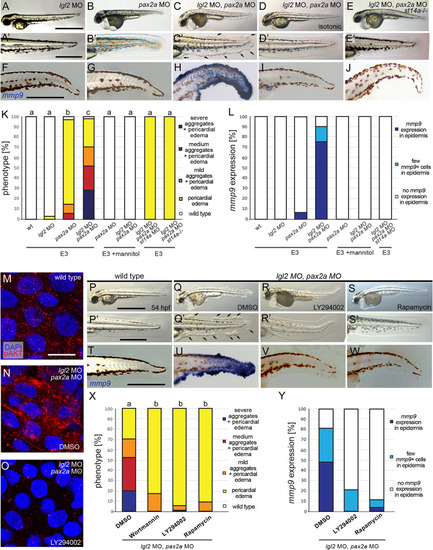
Polarity defects combined with hypotonic stress cause aberrant activation of the Matriptase-PI3K-pAKT-mTORC1 pathway and pre-neoplastic transformations of basal keratinocytes in the embryonic zebrafish epidermis. (A-E’) Brightfield images of live 54 hpf embryos morphant for lgl2 to induce polarity defects, morphant for pax2a to induce hypotonic stress, or morphant for both lgl2 and pax2a; overviews of entire embryos (A-E) and magnified views of tail regions (A’-E’). Whereas lgl2 (A,A’) and pax2a knockdown (B,B’) alone do not result in epidermal defects, the combination of both causes epidermal aggregate formation (C,C’; indicated in C’ with arrows), which is abrogated by isotonic conditions (D,D’, raised in E3 + 250 mM Mannitol) or in st14a mutants (E,E’). Scale bar: 500 μm in overview, 100 μm in magnified image. (F-J) Whole mount in situ hybridization for mmp9 transcripts showing mmp9 expression only in pax2a, lgl2 double morphant embryos raised in hypotonic conditions (H) but not in single morphants (F,G), or double morphants raised in isotonic conditions (I) or in a st14a mutant background (J). Scale bar: 100 μm. (K) Quantification of phenotypes of embryos with different genotypes / morphant conditions under hypotonic (E3) and isotonic (E3 + 250 mM Mannitol) conditions (N = 2–4, n = 22–106; significances were determined via a one-way ANOVA and Tukey’s post hoc test by comparing fraction of embryos displaying an epidermal phenotype (mild, medium, and strong) with no epidermal phenotype; columns with same superscript letter (a,b,c) are not significantly different (p>0.05).). (L) Quantification of embryos with different morphant conditions under hypotonic (E3) and isotonic (E3 + 250 mM Mannitol) conditions displaying strong mmp9 expression, few mmp9 positive cells, or no mmp9 expression in the epidermis (n = 30–41). (M-O) Immunofluorescence for pAKT on whole mounts, lateral views on trunk regions, showing increased pAKT levels in basal keratinocytes in 54 hpf lgl2, pax2a double morphants (N) compared to wild-type embryo (M) or lgl2, pax2a double morphants treated with the PI3K inhibitor LY294002 (n = 12–15). (O). Scale bar: 10 μm. (P-S’) Bright field images of live 54 hpf lgl2, pax2a, double morphant embryos as overviews of entire embryos (P-S) or magnified views of tail regions (P’-S’), showing aggregate formation in the DMSO control (Q,Q; indicated in Q’ by arrows’), which is abolished by treating with 25 μM LY294002 (R, R’) or 1.1 μM Rapamycin (S,S’). Scale bar: 500 μm in overview, 100 μm in magnified image. (T-W). Whole mount in situ hybridization for mmp9 transcripts showing mmp9 upregulation in 58 hpf pax2a, lgl2 double morphant in the DMSO control (U) but no mmp9 expression in wild type (T), or in LY294002 (V) or Rapamycin (W) treated lgl2, pax2a double morphant. Scale bar: 100 μm. (X) Quantification of epidermal aggregates and pericardial edema phenotypes in embryos, representatives of which are shown in (P-S’) (n = 17–34 embryos per condition from N = 3–5 independent experiments, Significances were determined via a one-way ANOVA and Tukey’s post hoc test by comparing fraction of embryos displaying an epidermal phenotype (mild, medium, and strong) with no epidermal phenotype; columns with same superscript letter (a,b,c) are not significantly different (p>0.001).)).). (X) Quantification of embryos with widespread, scarce or no mmp9 expression in the epidermis, representatives of which are shown in (T-W) (n = 26–29 embryos per condition from N = 3 independent experiments).
|