
- Title
-
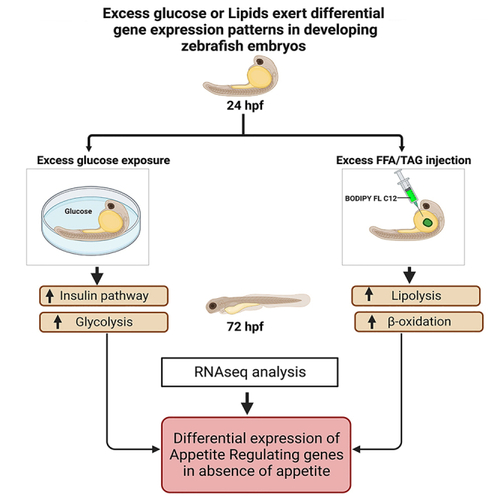
Excess glucose or fat differentially affects metabolism and appetite-related gene expression during zebrafish embryogenesis
- Authors
- Konadu, B., Cox, C.K., Garrett, M.R., Gibert, Y.
- Source
- Full text @ iScience
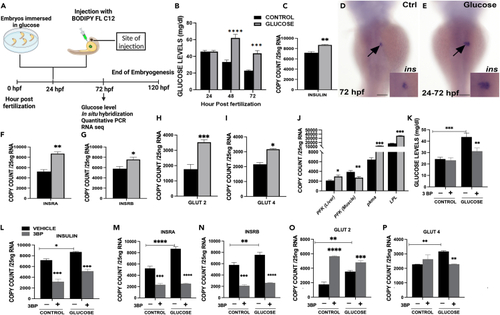
Effect of glucose on zebrafish embryos (A) Timeline of treatment for embryos exposed to glucose or injected with free fatty acid/TAG at 24 hpf. (B) Embryonic glucose concentrations at different time points during development following glucose treatment at 24 hpf. (C) Insulin mRNA expression at 72 hpf. WISH of insulin mRNA expression 48 h after glucose exposure (arrows), insets are close up of insulin expression in the developing islet. (D) Control. (E) Glucose exposed. (F–I) mRNA expression of insulin receptors (INSRA and INSRB), Glucose transporters (Glut 2 and Glut 4) at 72 hpf. (J–P) mRNA expression of tissue specific genes phosphofructokinase (liver and muscle isoform), pyruvate kinase M1/2a and lipoprotein lipase K. Quantification glucose levels for embryos co-exposed with glucose and 3-Bromopyruvate (3-BP), (−) vehicle (control, glucose) without 3-BP, (+) (control, glucose) with 3-BP. mRNA expression of: L. insulin; M-N. insulin receptors (A, B); O-P. Glucose transporters (Glut 2 and Glut 4) of embryos treated with 3-BP. ∗ Represent statistically significant threshold levels (∗p < 0.05, ∗∗p < 0.01,∗∗∗p < 0.001,∗∗∗∗p < 0.0001). Scale bar 100 μm. |
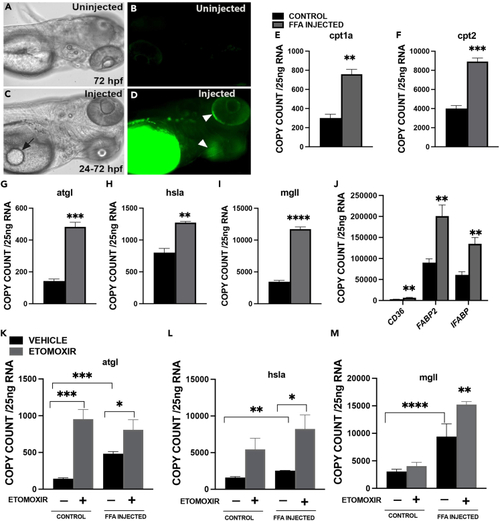
Effects of FFA/TAG injection on zebrafish embryos. BODIPY-labeled fluorescent FLC12 FFA/TAG injected into the yolk sac of 72 hpf embryos (A) Control in bright field (BF). (B) Control- Fluorescent image. (C) FFA/TAG injected embryo displaying the site of injection (arrow). (D–F) Fluorescent FFA injected embryos with diverging fluorescence (white arrowheads). Bar plots showing mRNA expression of Carnitine Palmitoyl transferase (cpt1a (E), cpt2 (F)). (G) Adipocyte triglyceride lipase (atgl). (H) Hormone sensitive lipase a (hsla). (I–L) monoglyceride lipase mgll and J. lipid transporter or binding protein, (cluster of differentiation 36 (CD36), fatty acid-binding protein 2 (FABP2) and intestinal fatty acid-binding protein 2 (IFABP). Exposure of FFA/TAG injected embryos to etomoxir or vehicle (control, FFA/TAG injected) for the quantification of mRNA expression of K. Adipocyte triglyceride lipase (atgl); L. Hormone sensitive lipase a (hsla). (M) monoglyceride lipase (mgll). In panels G-I, a significant difference between group means was determined using the Student’s t test, whereas in panels K-M, a two-way ANOVA test was performed. (∗p < 0.05, ∗∗p < 0.01∗∗∗p < 0.001, ∗∗∗∗p < 0.0001). Scale bar 100 μm. |
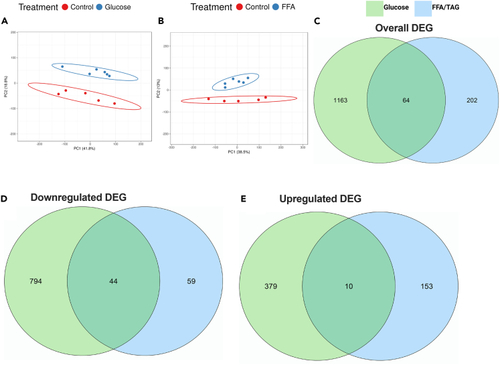
Sample population clusters and the number of differentially expressed genes in glucose-exposed and FFA/TAG-injected embryos PCA plot displaying discrete and distinct population clusters between treatment groups. (A) Glucose exposed versus Control. (B) FFA/TAG injected versus Control. Venn Diagrams summarizing the intersection of genes between treatment groups. (C) Overall genes that were significantly differentially expressed between glucose-exposed versus control and FFA/TAG-injected versus control. (D) Downregulated genes differentially expressed in glucose-exposed versus control and FFA/TAG-injected versus control. (E) Upregulated genes differentially expressed in glucose-exposed versus control and FFA/TAG-injected versus control. |
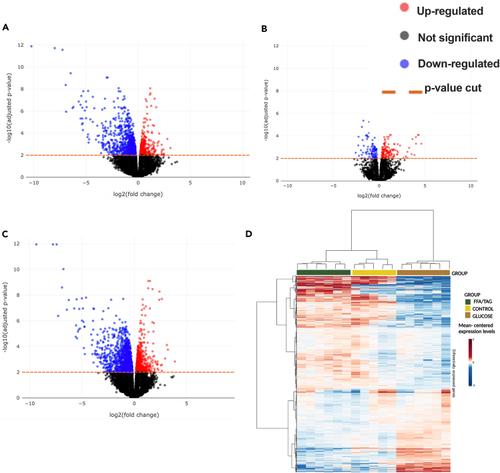
Gene association test (A–D) Volcano plots for all comparisons showing significance (as -log10 transformed p value) against magnitude (log2 (fold change). Genes identified as significantly differentially expressed are represented as red (upregulated) or blue (downregulated) or black (non-significant) dots. The horizontal orange line represents the applied p value threshold A. Glucose versus Control; B. FFA/TAG versus Control; C. Glucose versus FFA/TAG injected D. Heatmap showing gene intensity per sample relative to the average level across all samples. Individual genes are shown on the Y axis while samples are shown along the X axis. Red and blue cells correspond to higher and lower RNA-seq levels, respectively. |
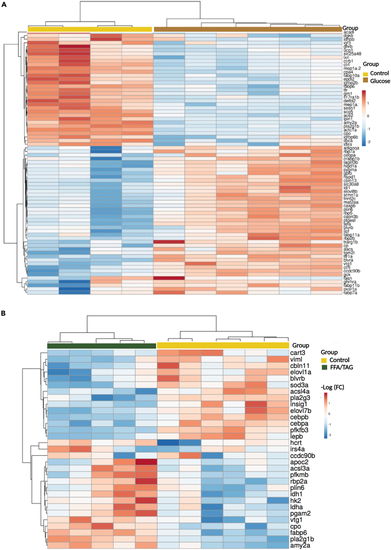
Heatmap analysis of differentially expressed genes Heatmap showing gene intensity per sample relative to the average level across all samples. Individual genes are shown on the Y-axis while samples are shown along the X axis. The first 50 upregulated or downregulated genes represented within a range of (−2 to 2) of log 2 of the fold change were chosen. (A) Shows downregulated (blue) and upregulated (red) genes of treatment glucose compared to controls. (B) Shows downregulated (blue) and upregulated (red) genes of FFA/TAG injected samples compared to controls. |
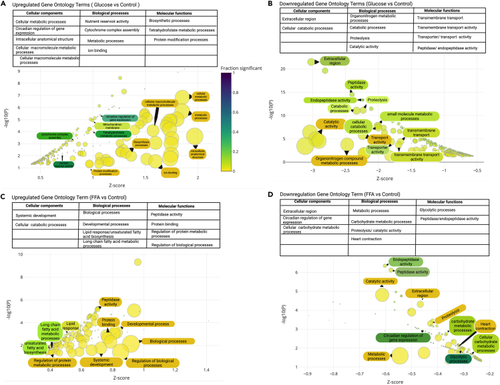
Bubble plots depicting significantly enriched Gene Ontology terms Enrichment analyses with enrichment Z score on the X axis and -log10(p value) on the y axis. Point size represents term size and point color represents the fraction of genes that were significant. Gene ontology terms range from highly significant (blue) to less significant (yellow). Only GO terms with an enrichment p value less than 0.05, were included. Furthermore, only the top 50 terms are displayed. In addition, terms were restricted to include only those with 2 or more genes. (A) Upregulated Gene ontology terms between glucose exposed embryos and their controls with GO terms classified in the table above. (B) Downregulated Gene Ontology term between glucose exposed and controls with GO terms classified in the table above. (C) Upregulated Gene ontology terms between FFA injected and controls with GO terms classified in the table above. (D) Downregulated Gene Ontology term between FFA injected and controls with GO terms classified in the table above. |
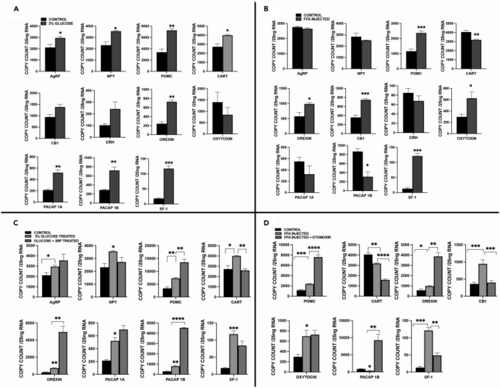
Differential expression of appetite regulation genes at 72 hpf in glucose exposed or FFA/TAG injected embryos (A) mRNA expression of genes in glucose exposed embryos compared to controls (Agouti-related Peptide (AgRP), Neuropeptide Y(NPY), Proopiomelanocortin (POMC), Cocaine- and Amphetamine-regulated Transcript (CART), Orexin, cannabinoid receptor type 1 (CB1), Corticotropin-releasing hormone (CRH), Oxytocin, Pituitary adenylate-cyclase activating peptide (PACAP 1A/1B), Steroidal factor-1 (SF-1). (B) Expression of genes in FFA/TAG injected embryos compared to controls (Agouti-related Peptide (AgRP), Neuropeptide Y(NPY), Proopiomelanocortin (POMC), Cocaine- and Amphetamine-regulated Transcript (CART), Orexin, cannabinoid receptor type 1 (CB1), Corticotropin-releasing hormone (CRH), Oxytocin, Pituitary adenylate-cyclase activating peptide (PACAP 1A/1B), Steroidal factor 1 (SF-1). (C) Compares mRNA expression in glucose exposed embryos and controls to the expression in embryos co-exposed to glucose and 3-Bromopyruvate in significant expressed appetite-regulating genes in Figure 7A. (D) Compares mRNA expression in FFA/TAG injected embryos and controls to the expression in FFA/TAG embryos co-exposed to etomoxir in significant expressed appetite-regulating genes in Figure 7B. ∗ Represent statistically significant threshold levels (∗p < 0.05, ∗∗p < 0.01∗∗∗, p < 0.001,∗∗∗∗p < 0.0001). |
|