
Fig. 6
- ID
- ZDB-FIG-231207-62
- Publication
- Konadu et al., 2023 - Excess glucose or fat differentially affects metabolism and appetite-related gene expression during zebrafish embryogenesis
- Other Figures
- All Figure Page
- Back to All Figure Page
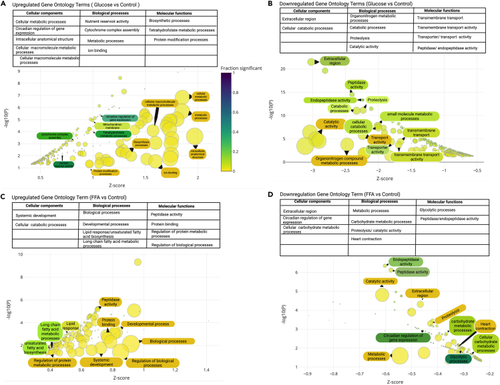
Bubble plots depicting significantly enriched Gene Ontology terms Enrichment analyses with enrichment Z score on the X axis and -log10(p value) on the y axis. Point size represents term size and point color represents the fraction of genes that were significant. Gene ontology terms range from highly significant (blue) to less significant (yellow). Only GO terms with an enrichment p value less than 0.05, were included. Furthermore, only the top 50 terms are displayed. In addition, terms were restricted to include only those with 2 or more genes. (A) Upregulated Gene ontology terms between glucose exposed embryos and their controls with GO terms classified in the table above. (B) Downregulated Gene Ontology term between glucose exposed and controls with GO terms classified in the table above. (C) Upregulated Gene ontology terms between FFA injected and controls with GO terms classified in the table above. (D) Downregulated Gene Ontology term between FFA injected and controls with GO terms classified in the table above. |