FIGURE
            Fig. 5
- ID
 - ZDB-FIG-231207-61
 - Publication
 - Konadu et al., 2023 - Excess glucose or fat differentially affects metabolism and appetite-related gene expression during zebrafish embryogenesis
 - Other Figures
 - All Figure Page
 - Back to All Figure Page


                        Fig. 5


| 


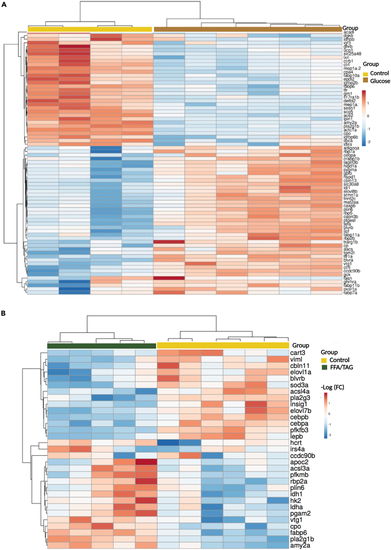
 Heatmap analysis of differentially expressed genes Heatmap showing gene intensity per sample relative to the average level across all samples. Individual genes are shown on the Y-axis while samples are shown along the X axis. The first 50 upregulated or downregulated genes represented within a range of (−2 to 2) of log 2 of the fold change were chosen. (A) Shows downregulated (blue) and upregulated (red) genes of treatment glucose compared to controls. (B) Shows downregulated (blue) and upregulated (red) genes of FFA/TAG injected samples compared to controls.  | 


                        Expression Data


                        Expression Detail


                        Antibody Labeling


                        Phenotype Data


                        Phenotype Detail


                        Acknowledgments


This image is the copyrighted work of the attributed author or publisher, and
ZFIN has permission only to display this image to its users.
Additional permissions should be obtained from the applicable author or publisher of the image.
      Full text @ iScience