
Fig. 7
- ID
- ZDB-FIG-231207-63
- Publication
- Konadu et al., 2023 - Excess glucose or fat differentially affects metabolism and appetite-related gene expression during zebrafish embryogenesis
- Other Figures
- All Figure Page
- Back to All Figure Page
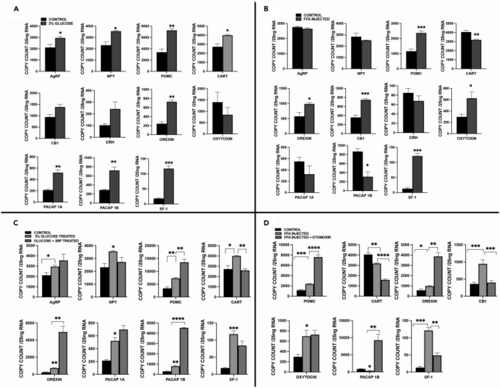
Differential expression of appetite regulation genes at 72 hpf in glucose exposed or FFA/TAG injected embryos (A) mRNA expression of genes in glucose exposed embryos compared to controls (Agouti-related Peptide (AgRP), Neuropeptide Y(NPY), Proopiomelanocortin (POMC), Cocaine- and Amphetamine-regulated Transcript (CART), Orexin, cannabinoid receptor type 1 (CB1), Corticotropin-releasing hormone (CRH), Oxytocin, Pituitary adenylate-cyclase activating peptide (PACAP 1A/1B), Steroidal factor-1 (SF-1). (B) Expression of genes in FFA/TAG injected embryos compared to controls (Agouti-related Peptide (AgRP), Neuropeptide Y(NPY), Proopiomelanocortin (POMC), Cocaine- and Amphetamine-regulated Transcript (CART), Orexin, cannabinoid receptor type 1 (CB1), Corticotropin-releasing hormone (CRH), Oxytocin, Pituitary adenylate-cyclase activating peptide (PACAP 1A/1B), Steroidal factor 1 (SF-1). (C) Compares mRNA expression in glucose exposed embryos and controls to the expression in embryos co-exposed to glucose and 3-Bromopyruvate in significant expressed appetite-regulating genes in Figure 7A. (D) Compares mRNA expression in FFA/TAG injected embryos and controls to the expression in FFA/TAG embryos co-exposed to etomoxir in significant expressed appetite-regulating genes in Figure 7B. ∗ Represent statistically significant threshold levels (∗p < 0.05, ∗∗p < 0.01∗∗∗, p < 0.001,∗∗∗∗p < 0.0001). |