
Fig. 3
- ID
- ZDB-IMAGE-231207-60
- Publication
- Konadu et al., 2023 - Excess glucose or fat differentially affects metabolism and appetite-related gene expression during zebrafish embryogenesis
- All Figures
- Figures for Konadu et al., 2023
|
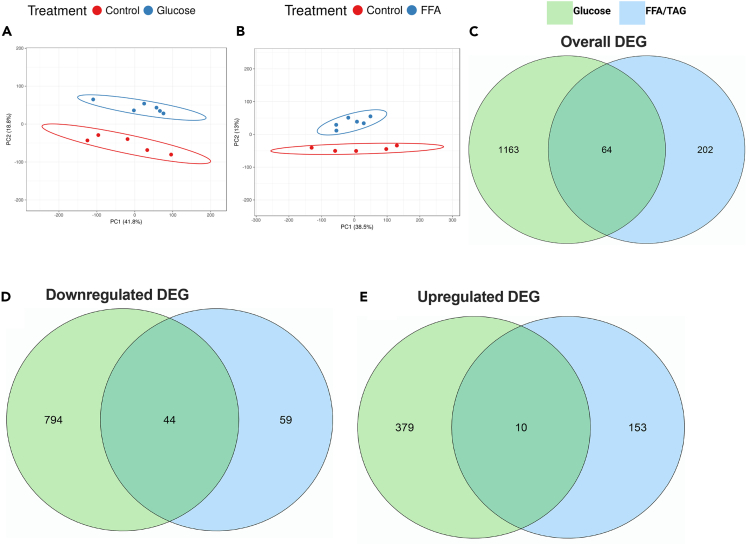
Fig. 3 Sample population clusters and the number of differentially expressed genes in glucose-exposed and FFA/TAG-injected embryos PCA plot displaying discrete and distinct population clusters between treatment groups. (A) Glucose exposed versus Control. (B) FFA/TAG injected versus Control. Venn Diagrams summarizing the intersection of genes between treatment groups. (C) Overall genes that were significantly differentially expressed between glucose-exposed versus control and FFA/TAG-injected versus control. (D) Downregulated genes differentially expressed in glucose-exposed versus control and FFA/TAG-injected versus control. (E) Upregulated genes differentially expressed in glucose-exposed versus control and FFA/TAG-injected versus control.