
Fig. 1
- ID
- ZDB-IMAGE-231207-58
- Publication
- Konadu et al., 2023 - Excess glucose or fat differentially affects metabolism and appetite-related gene expression during zebrafish embryogenesis
- All Figures
- Figures for Konadu et al., 2023
|
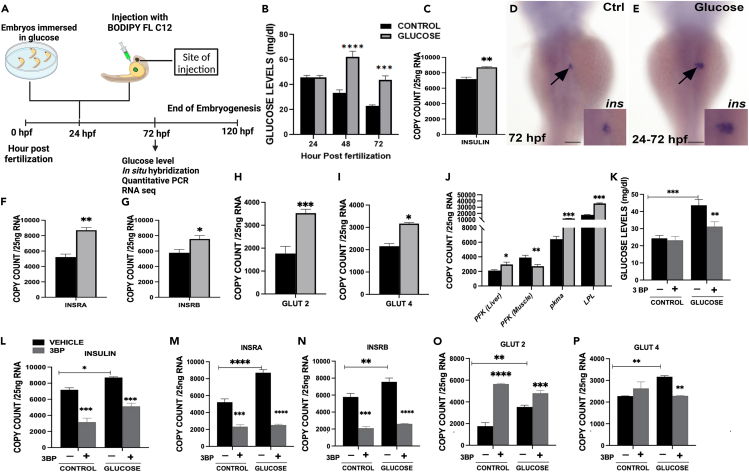
Fig. 1 Effect of glucose on zebrafish embryos (A) Timeline of treatment for embryos exposed to glucose or injected with free fatty acid/TAG at 24 hpf. (B) Embryonic glucose concentrations at different time points during development following glucose treatment at 24 hpf. (C) Insulin mRNA expression at 72 hpf. WISH of insulin mRNA expression 48 h after glucose exposure (arrows), insets are close up of insulin expression in the developing islet. (D) Control. (E) Glucose exposed. (F–I) mRNA expression of insulin receptors (INSRA and INSRB), Glucose transporters (Glut 2 and Glut 4) at 72 hpf. (J–P) mRNA expression of tissue specific genes phosphofructokinase (liver and muscle isoform), pyruvate kinase M1/2a and lipoprotein lipase K. Quantification glucose levels for embryos co-exposed with glucose and 3-Bromopyruvate (3-BP), (−) vehicle (control, glucose) without 3-BP, (+) (control, glucose) with 3-BP. mRNA expression of: L. insulin; M-N. insulin receptors (A, B); O-P. Glucose transporters (Glut 2 and Glut 4) of embryos treated with 3-BP. ∗ Represent statistically significant threshold levels (∗p < 0.05, ∗∗p < 0.01,∗∗∗p < 0.001,∗∗∗∗p < 0.0001). Scale bar 100 μm.