
Fig. 2
- ID
- ZDB-IMAGE-231207-59
- Publication
- Konadu et al., 2023 - Excess glucose or fat differentially affects metabolism and appetite-related gene expression during zebrafish embryogenesis
- All Figures
- Figures for Konadu et al., 2023
|
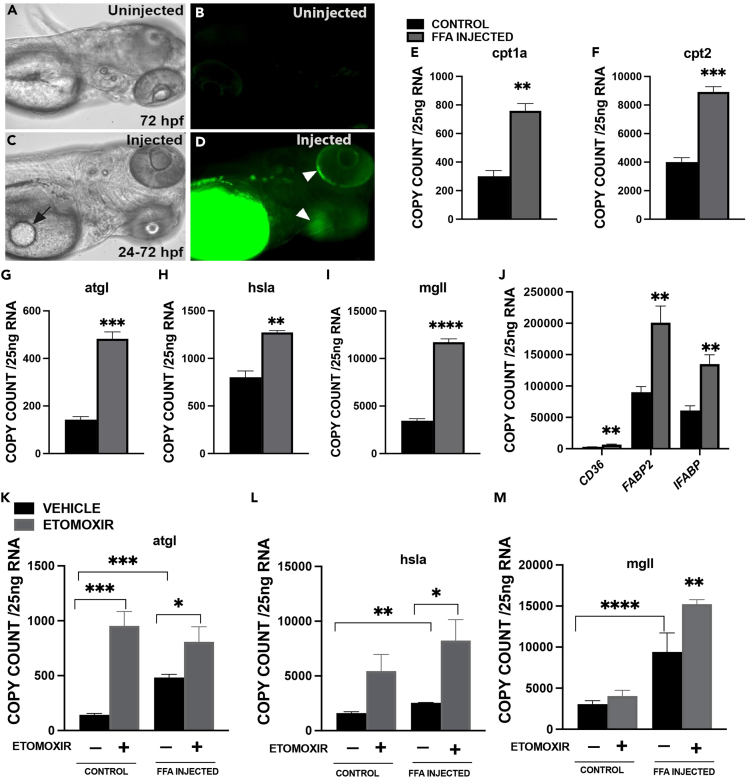
Fig. 2 Effects of FFA/TAG injection on zebrafish embryos. BODIPY-labeled fluorescent FLC12 FFA/TAG injected into the yolk sac of 72 hpf embryos (A) Control in bright field (BF). (B) Control- Fluorescent image. (C) FFA/TAG injected embryo displaying the site of injection (arrow). (D–F) Fluorescent FFA injected embryos with diverging fluorescence (white arrowheads). Bar plots showing mRNA expression of Carnitine Palmitoyl transferase (cpt1a (E), cpt2 (F)). (G) Adipocyte triglyceride lipase (atgl). (H) Hormone sensitive lipase a (hsla). (I–L) monoglyceride lipase mgll and J. lipid transporter or binding protein, (cluster of differentiation 36 (CD36), fatty acid-binding protein 2 (FABP2) and intestinal fatty acid-binding protein 2 (IFABP). Exposure of FFA/TAG injected embryos to etomoxir or vehicle (control, FFA/TAG injected) for the quantification of mRNA expression of K. Adipocyte triglyceride lipase (atgl); L. Hormone sensitive lipase a (hsla). (M) monoglyceride lipase (mgll). In panels G-I, a significant difference between group means was determined using the Student’s t test, whereas in panels K-M, a two-way ANOVA test was performed. (∗p < 0.05, ∗∗p < 0.01∗∗∗p < 0.001, ∗∗∗∗p < 0.0001). Scale bar 100 μm.