FIGURE SUMMARY
Title

Genome-wide screening in pluripotent cells identifies Mtf1 as a suppressor of mutant huntingtin toxicity

Authors
Ferlazzo, G.M., Gambetta, A.M., Amato, S., Cannizzaro, N., Angiolillo, S., Arboit, M., Diamante, L., Carbognin, E., Romani, P., La Torre, F., Galimberti, E., Pflug, F., Luoni, M., Giannelli, S., Pepe, G., Capocci, L., Di Pardo, A., Vanzani, P., Zennaro, L., Broccoli, V., Leeb, M., Moro, E., Maglione, V., Martello, G.
Source
Full text @ Nat. Commun.

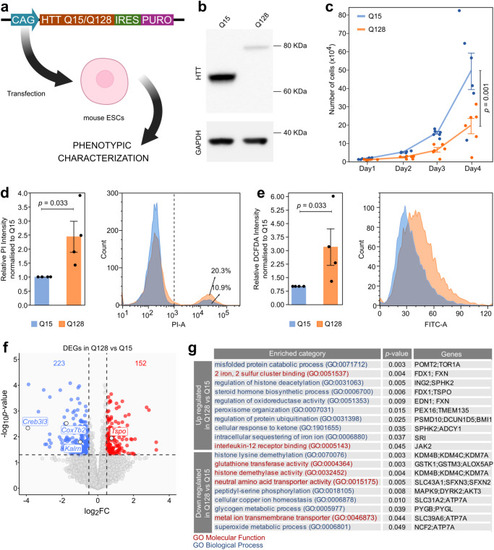
Establishment and characterisation of mHTT-expressing mouse ESCs.

a Strategy for generation and characterisation of mouse ESCs (Rex1GFP-d2) expressing N-terminal fragment of either mutant (128 CAG repeats) or WT (15 CAG repeats) HTT by DNA transfection and puromycin selection, named Q15 and Q128 cells, respectively. Created with BioRender.com. b Western Blot for HTT confirmed the correct production of a 80 kDa and a 65 kDa form of HTT protein in Q128 and Q15 cells. GAPDH was used as loading control. The Western Blot shown is representative of 2 independent experiments with 2 technical replicates. c Proliferation assay of Q128 and Q15 cells. Lines indicate the mean ± standard error of the mean (SEM) of 6 independent experiments shown as dots. P-values were calculated with Two-way Repeated Measure ANOVA. d Measurement of cell death by PI uptake and Flow Cytometry. Left: the fraction of PI-positive cells (on the right of the dashed line) was calculated for each sample and fold-changes (FCs) were calculated relative to the Q15 samples. Bars indicate the mean ± SEM of 4 independent experiments shown as dots. Right: representative flow cytometry plots. P-values were calculated with one-tailed one sample Mann-Whitney U test. e Left: measurement of H2DCFDA median fluorescence as an evaluation of ROS production in Q15 versus Q128 cells. Bars indicate the mean ± SEM of 4 independent experiments shown as dots. FCs were calculated relative to the Q15 samples. Right: representative flow cytometry profiles. P-values were calculated with one-tailed one sample Mann-Whitney U test. f Transcriptome analysis of Q128 and Q15 cells. Down-regulated (log2 FC  <  −0.5 and p-value  <0.05) and Up-regulated (log2 FC  >  0.5 and p-value  <0.05, indicated by dashed lines) genes are indicated in blue and red, respectively. P-values were calculated with two-tailed Wald Test with no adjustment. N = 6 biological replicates for Q15 and n = 7 for Q128 cells. g Gene list enrichment analysis of genes down- or up-regulated in Q128 cells, compared to Q15, identified in Fig. 1f. Categories from the Gene Ontology database for Biological processes or molecular functions are shown in blue or red, respectively. P-values were calculated by two-tailed Fisher Exact test using Enrichr software.

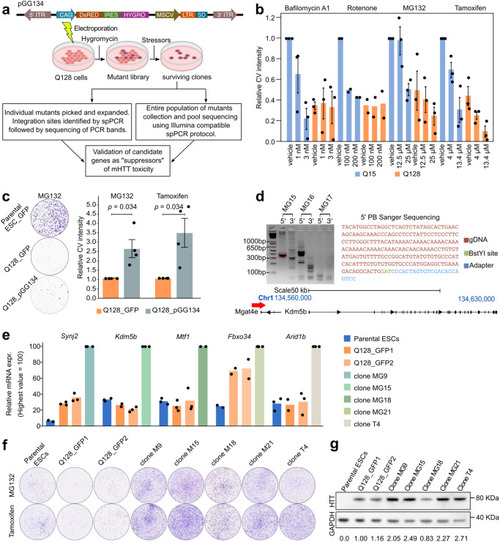
A gain-of-function screen for suppressors of mHTT toxicity.

a Top: diagram of the PB vector pGG13454. Bottom: diagram of the screening strategy used to identify proteins involved in HTT-dependent toxicity. Created with BioRender.com. b Number of surviving cells scored by quantification of Crystal Violet (CV) staining-positive colonies upon treatment for 48 hours with the selected compounds. Bars indicate the mean ± SEM of at least 2 independent experiments, shown as dots. Data were normalised to Q15 vehicles samples. c Left: representative images of parental mouse ESCs or Q128 cells electroporated with PB vector encoding for GFP and Q128 cells electroporated with pGG134 vector, treated with MG132 for 5 days and stained with CV. Right: intensity of CV signal of surviving Q128_pGG134 colonies compared to Q128_GFP after mutagenesis and selection in presence of MG132 or Tamoxifen. Bars indicate the mean ± SEM of 4 independent experiments, shown as dots, normalised to Q128_GFP. P-values were calculated with a one-tailed one sample Mann-Whitney U test. d Steps for the identification of integration site in the MG15 clone by Splinkerette-PCR. The band corresponding to amplification of 5’ end (red dashed square) of the pGG134 in MG15, was excised, purified and sequenced. Each clone was analysed at least two times independently. The sequence obtained (top right) was then aligned to the mouse genome, allowing identification in the MG15 clone of PB vector insertion upstream of the Kdm5b gene (bottom panel). e Expression analysis by qPCR of Synj2, Kdm5b, Mtf1, Fbxo34 and Arid1b genes. Bars indicate the mean of 3 technical replicates shown as dots. Expression was normalised to the highest value. f Representative CV staining images of Q128 cells and 5 clones selected from Q128_pGG134 mutant population. g Western Blot confirmed HTT protein presence in all clones. Values shown below each clone are the mean of HTT intensity normalised to GAPDH intensity, used as loading control. Similar results were obtained in two additional technical replicates.

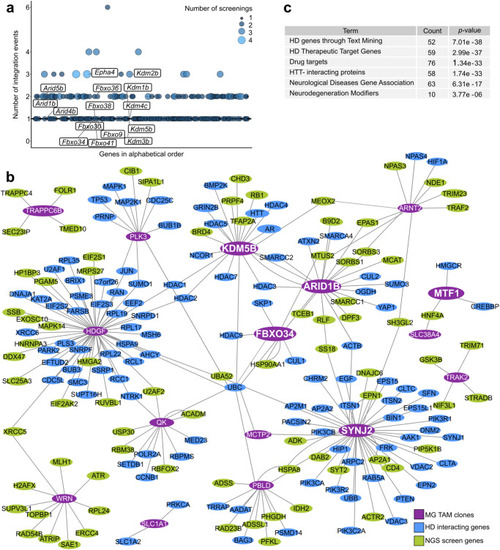
Network analysis of candidate suppressors of mHTT toxicity.

a Bubble plot representing the number of independent integration events for each NGS hit (1356 hits, represented by bubbles and ordered along the x axis in alphabetical order). Size and colours of the bubbles are related to the number of independent screening experiments in which they were found. Labels indicate relevant candidate genes and additional genes belonging to the same families. b The interactome, realised with Cytoscape141, shows physical and regulatory interactions of over-activated genes in mHTT-resistant clones with HD related genes, retrieved through HDNetDB56, and genes identified from NGS screening. Main nodes correspond to the mutated genes of HTT-resistant clones (violet label), HD related genes are marked with a blue label and hits from the NGS screening are represented with green labels. c Enrichment analysis of the genes represented in the interactome (Fig. 3b) based on HD gene sets using HDNetDB. Statistical enrichment and p-values were calculated using the hypergeometric distribution.

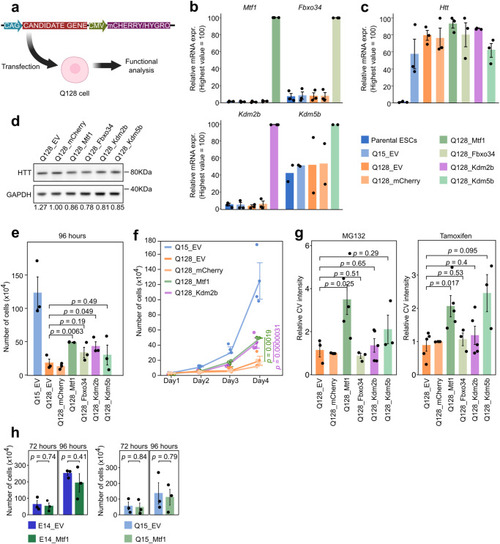
Secondary validation of mHTT suppressors.

a Diagram of the secondary validation experiments: the cDNA of candidate genes was stably expressed in Q128 cells. An empty vector (EV) and a vector containing only mCherry cDNA served as negative controls. Created with BioRender.com. b Gene expression analysis by qPCR of Mtf1, Kdm2b, Kdm5b and Fbxo34 confirmed increased levels of genes in corresponding cell lines in which they were overexpressed. Bars indicate the mean ± SEM of 3 independent experiments (Mtf1, Fbxo34, Kdm2b) and 2 independent experiments (Kdm5b) shown as dots. Expression was normalised to the highest value. c qPCR analyses for HTT mRNA. Bars indicate the mean ± SEM of 3 independent experiments shown as dots. Expression was normalised to the highest value. d Western Blot analyses of HTT protein in Q128 cells transfected with different constructs. GAPDH was used as loading control. Values shown below lane are the mean of n = 3 technical replicates of HTT intensity normalised to GAPDH intensity. e Proliferation assay results at 96 hours of the indicated cell lines. Bars indicate the mean ± SEM of 3 independent experiments, shown as dots. P-values were calculated with unpaired two-tailed t-test, comparing each candidate to the Q128_EV sample. f Proliferation assay of the indicated cell lines. Bars indicate the mean ± SEM of 3 independent experiments, shown as dots. P-values were calculated with Two-way Repeated Measure ANOVA, comparing each candidate to the Q128_EV sample. g CV quantification showing the number of surviving colonies in Q128_Mtf1, Q128_Kdm5b and Q128_Fbxo34 cells after 48 hours of treatments with MG132 (left panel) or Tamoxifen (right panel), compared to the Q128 cell lines. Bars indicate the mean values ±  SEM from at least 3 independent experiments. P-values were calculated with unpaired two-tailed t-test, comparing each candidate to the Q128_EV sample. h Proliferation assay at 72 and 96 hours for parental ESCs (E14) and Q15 cells, expressing either an EV or Mtf1. Bars indicate the mean ± SEM of 3 independent experiments, shown as dots. P-values were calculated with unpaired two-tailed t-test, comparing each candidate EV sample.

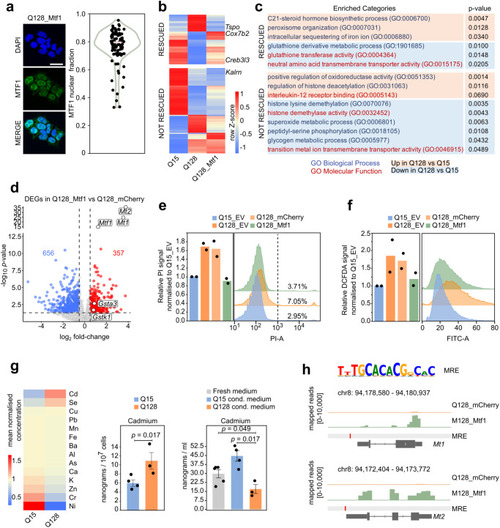
Mtf1 regulates HD-related processes

a Left: Immunofluorescence for MTF1 in Q128_Mtf1 cells, representative of n = 3 experiments. Nuclei were stained with DAPI. Scale bar, 30 μm. Right: Violin plot showing the fraction of MTF1 nuclear signal over the total signal from 1 experiment. b Heatmap showing the effect of Mtf1 overexpression on DEGs between Q128 and Q15 cells. MTF1 rescued 138 genes (p-value ≥ 0.05 between Q128_Mtf1 and Q15 and log2 FC > |0.5| between Q128_Mtf1 and Q128). Mean expression of n = 6 (Q15), n = 7 (Q128), and n = 6 biological replicates (Q128_Mtf1). Z-score calculated on row-scaled expression values. c Processes altered by mHTT and enriched among genes rescued, or not rescued, by MTF1. P-values were calculated by two-tailed Fisher Exact test using Enrichr software. d RNAseq on Q128_Mtf1 and Q128_mCherry cells. DOWN-regulated (log2 FC  <  −0.5 and p-value  <0.05) and UP-regulated (log2 FC  > 0.5 and p-value  <0.05, dashed lines) genes are indicated in blue and red, respectively. P-values were calculated with two-tailed Wald Test with no adjustment. N = 7 (Q128_mCherry) and n = 6 biological replicates (Q128_Mtf1 cells). e Measurement of cell death by PI uptake and Flow Cytometry. Bars indicate the mean of 2 independent experiments, shown as dots. Representative profiles are shown on the right. f Measurement of ROS production by H2DCFDA staining. Bars indicate the mean of 2 independent experiments shown as dots. Representative profiles are on the right. g Cellular uptake of metals in Q15 and Q128 cell lines. Left: heatmap of mean-normalised intracellular concentrations. Measurements of total intracellular (middle) and extracellular (right) amount of Cadmium in Q15_HTT and Q128_HTT cells. Fresh medium served as negative control. Mean and SEM of at least 3 biological replicates, shown as dots. P-values calculated with the unpaired two-tailed Mann-Whitney U test. h Top: consensus sequence recognised by MTF1 from Jaspar database, identified in MREs. Bottom: gene tracks for Mt1 and Mt2, showing the expression levels in Q128_Mtf1 and Q128_mCherry cells; one representative biological replicate of RNA sequencing data is shown for each cell line.

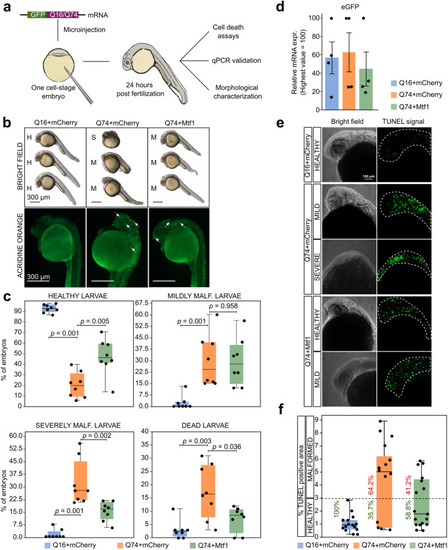
Mtf1 counteracts mHTT effects in zebrafish.

a Schematic representation of validation experiments performed in Zebrafish HD model obtained by injection of Q16eGFP or Q74eGFP mRNAs into the yolk of one cell-stage embryos. 24 hpf, embryos were collected for phenotypic and molecular analyses. b Representative images of 24 hours-stage embryos, injected with either Q16eGFP+mCherry, Q74eGFP+mCherry or with Q74eGFP+Mtf1 (250 pg/embryo + 250 pg/embryo), stained with the Acridine Orange. Top: Bright-field images show the morphology of representative injected embryos. Bottom: fluorescent microscopy shows increased Acridine Orange positive foci (white arrows). Images are lateral views with anterior at the top. Same results were obtained in 8 independent injection experiments. c Percentage of dead, malformed (severe or mild) and healthy embryos counted 24 hpf in 8 independent injection experiments, shown as dots. A total of 407, 511 and 621 embryos were analysed for Q16+mCherry, Q74+mCherry and Q74+Mtf1 samples, respectively. Box plots indicate 1st, 2nd and 3rd quartile; whiskers indicate minimum and maximum. P-values were calculated with the unpaired two-tailed Mann-Whitney U test. d eGFP gene-expression analysis by qPCR of Zebrafish embryos microinjected with eGFP and Q74+Mtf1 mRNAs. Bars indicate the mean ± SEM of 4 independent experiments shown as dots. Expression was normalised to the highest value. e Representative images of TUNEL assay on 30 hours-stage embryos from two independent experiments, injected with either Q16+mCherry or with Q74+mCherry or with Q74+Mtf1. Multiple focal planes were scanned for each embryo, spanning the entire depth of anterior structures, and z-projections were obtained on either bright-field and fluorescence channels. Q16+mCherry injected embryos revealed some basal TUNEL positivity, due to physiological apoptotic-dependent remodelling occurring at this stage of development. f Quantification of the percentage of TUNEL positive area over the total area (excluding the yolk region). Each dot represents an embryo (Q16+mCherry=15, Q74+mCherry=14, Q74+Mtf1 = 17). Box plots indicate 1st, 2nd and 3rd quartile; whiskers indicate minimum and maximum. The percentages of malformed and healthy embryos are shown in red and green, respectively. Healthy embryos are characterised by reduced TUNEL signal.

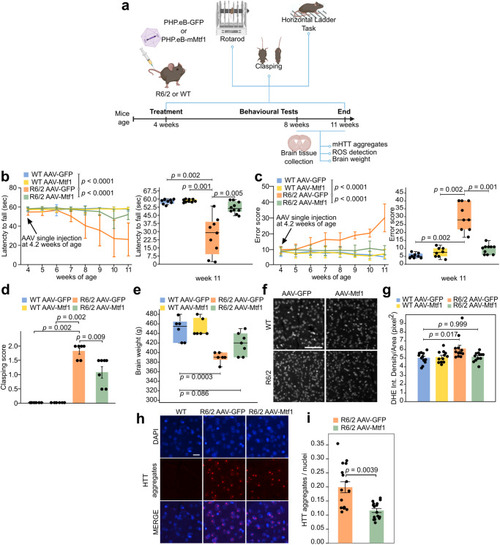
AAV-vector delivery of Mtf1 alleviates motor deficit in R6/2 mice.

a Summary of experiments performed in HD mice injected with AAVs. Adapted from “Behavioural Tests for Mice - Timeline” by BioRender.com (2023). b Motor performance assessed by Rotarod test. Line plots show mean ± standard deviation (SD) of each experimental group at each time point. Two-way repeated measure ANOVA. Box plots of the indicated experimental groups at 11 weeks of age. Number of mice, shown as dots: WT AAV-GFP = 8; WT AAV-Mtf1 = 9; R6/2 AAV-GFP = 9; R6/2 AAV-Mtf1 = 10. Two-tailed Mann-Whitney U test with Bonferroni correction. c Analysis of motor coordination on Horizontal Ladder task. Line plots show mean ± SD. Two-way repeated measure ANOVA. Box plots of the indicated experimental groups at 11 weeks of age. Number of mice, shown as dots: WT AAV-GFP = 8; WT AAV-Mtf1 = 8; R6/2 AAV-GFP = 9; R6/2 AAV-Mtf1 = 10. Two-tailed Mann-Whitney U test with Bonferroni correction. d Limb-clasping response at 7-8 weeks of age. Bars indicate the mean ± SD. N = 6 mice for each group. Two-tailed Wilcoxon test. e Brain weight measure. Number of mice, shown as dots: WT AAV-GFP = 6; WT AAV-Mtf1 = 6; R6/2 AAV-GFP = 6; R6/2 AAV-Mtf1 = 7. Values round off to the nearest 10 to account for minor differences in the dissection procedure. Two-way ANOVA with Bonferroni correction. f Detection of superoxide production by DHE. Representative images from 4 biological replicates. Scale bar, 50 μm. g Normalised DHE staining intensity. Bars indicate the mean ± SD. N = 4 mice for each group. N = 3 measurements for each mouse, shown as dots. Two-way ANOVA with Bonferroni correction. h Immunohistochemistry of the striatum of WT and R6/2 mice injected with either AAV-GFP or AAV-Mtf1 stained with EM48 antibody, which specifically detects mHTT aggregates. DAPI was used to detect nuclei. Scale bar, 10 μm. i Bars indicate the mean ± SD of the number of nuclear mHTT aggregates counted in 4 different levels for each animal of each group, shown as dots. N = 4 mice from each group were analysed. Two-tailed Mann-Whitney test. All box plots indicate 1st, 2nd and 3rd quartile; whiskers indicate minimum and maximum.

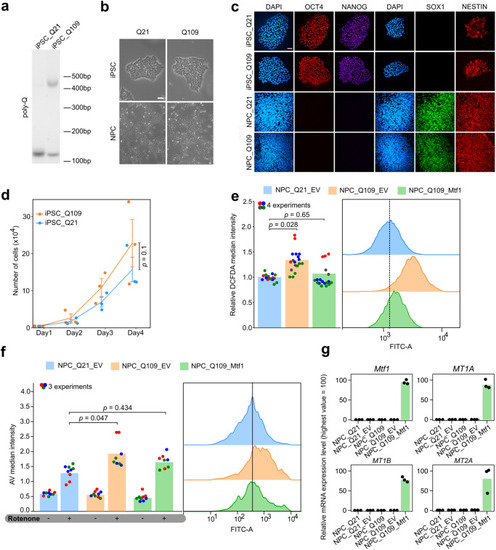
MTF1 rescues mHTT-dependent alterations in human NPCs.

a Genotyping of iPSC_Q21 and Q109 showed two amplicons for Q109 cell line (143 bp corresponds to WT allele with 19 CAG repeats, 470 bp corresponds to mutated allele with 109 CAG repeats), versus two overlapping bands in Q21 cell line. β-Actin was used as loading control. n = 1 experiment. b Brightfield images showing the morphology of iPSC_Q21, iPSC_Q109, NPC Q21, NPC Q109. Scale bar, 20 µm. Similar results were obtained in 7 independent experiments. c Immunofluorescence for pluripotency markers OCT4 and NANOG and early neural markers SOX1 and NESTIN of iPSC_Q21, iPSC_Q109, NPC_Q21, NPC_Q109. Scale bar, 40 µm. Similar results were obtained in 3 independent experiments. d Proliferation assay of iPSC_Q109 (orange) and iPSC_Q21 (blue) cells. Bars indicate the mean ± SEM of 3 independent experiments, shown as dots. P-value was calculated with Two-way Repeated Measure ANOVA. e Measurement of H2DCFDA fluorescence as an evaluation of ROS production in NPC_Q21_EV versus NPC_Q109_EV, NPC_Q109_Mtf1 cells. Representative flow cytometry profiles of ROS detection in NPC_Q21_EV, NPC_Q109_EV and NPC_Q109_Mtf1 are represented in the right panels. Bars indicate the mean of 4 independent experiments. For each experiment, technical replicates are shown as dots of different colours. FCs were calculated relative to the NPC_Q21_EV samples. P-values were calculated with unpaired two-tailed t-test. f Measurement of cell death by Annexin V uptake and Flow Cytometry. The fraction of Annexin V positive cells was calculated for each sample and FCs were calculated relative to the NPC_Q21_EV samples. Representative flow cytometry profiles of AV detection in NPC_Q21_EV, NPC_Q109_EV and NPC_Q109_Mtf1 are represented in the right panels. Bars indicate the mean of 3 independent experiments shown as dots (technical replicates of different experiments are presented with different colours). P-values were calculated with One-way Repeated Measure ANOVA with Tukey’s correction. g Gene expression analysis by qPCR of Mtf1 and metallothioneins MT1A, MT1B, MT2A in the indicated samples. N = 3 technical replicates, shown as dots. Expression was normalised to the highest value. Numerical values are provided in the Source data file.

Acknowledgments
This image is the copyrighted work of the attributed author or publisher, and ZFIN has permission only to display this image to its users. Additional permissions should be obtained from the applicable author or publisher of the image. Full text @ Nat. Commun.