|
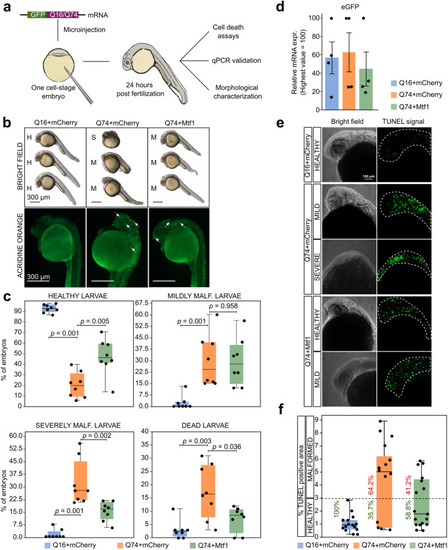
Mtf1 counteracts mHTT effects in zebrafish. a Schematic representation of validation experiments performed in Zebrafish HD model obtained by injection of Q16eGFP or Q74eGFP mRNAs into the yolk of one cell-stage embryos. 24 hpf, embryos were collected for phenotypic and molecular analyses. b Representative images of 24 hours-stage embryos, injected with either Q16eGFP+mCherry, Q74eGFP+mCherry or with Q74eGFP+Mtf1 (250 pg/embryo + 250 pg/embryo), stained with the Acridine Orange. Top: Bright-field images show the morphology of representative injected embryos. Bottom: fluorescent microscopy shows increased Acridine Orange positive foci (white arrows). Images are lateral views with anterior at the top. Same results were obtained in 8 independent injection experiments. c Percentage of dead, malformed (severe or mild) and healthy embryos counted 24 hpf in 8 independent injection experiments, shown as dots. A total of 407, 511 and 621 embryos were analysed for Q16+mCherry, Q74+mCherry and Q74+Mtf1 samples, respectively. Box plots indicate 1st, 2nd and 3rd quartile; whiskers indicate minimum and maximum. P-values were calculated with the unpaired two-tailed Mann-Whitney U test. d eGFP gene-expression analysis by qPCR of Zebrafish embryos microinjected with eGFP and Q74+Mtf1 mRNAs. Bars indicate the mean ± SEM of 4 independent experiments shown as dots. Expression was normalised to the highest value. e Representative images of TUNEL assay on 30 hours-stage embryos from two independent experiments, injected with either Q16+mCherry or with Q74+mCherry or with Q74+Mtf1. Multiple focal planes were scanned for each embryo, spanning the entire depth of anterior structures, and z-projections were obtained on either bright-field and fluorescence channels. Q16+mCherry injected embryos revealed some basal TUNEL positivity, due to physiological apoptotic-dependent remodelling occurring at this stage of development. f Quantification of the percentage of TUNEL positive area over the total area (excluding the yolk region). Each dot represents an embryo (Q16+mCherry=15, Q74+mCherry=14, Q74+Mtf1 = 17). Box plots indicate 1st, 2nd and 3rd quartile; whiskers indicate minimum and maximum. The percentages of malformed and healthy embryos are shown in red and green, respectively. Healthy embryos are characterised by reduced TUNEL signal.
|