|
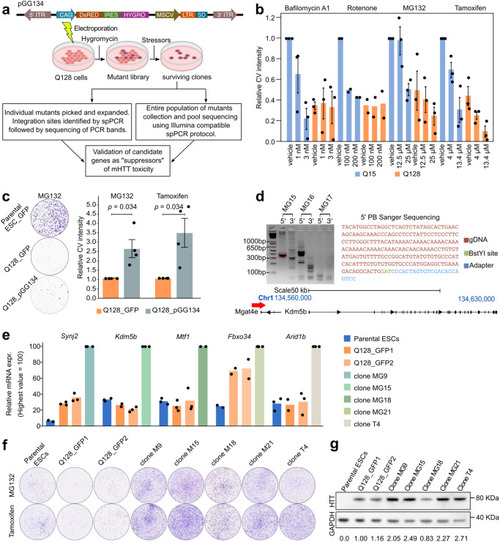
A gain-of-function screen for suppressors of mHTT toxicity. a Top: diagram of the PB vector pGG13454. Bottom: diagram of the screening strategy used to identify proteins involved in HTT-dependent toxicity. Created with BioRender.com. b Number of surviving cells scored by quantification of Crystal Violet (CV) staining-positive colonies upon treatment for 48 hours with the selected compounds. Bars indicate the mean ± SEM of at least 2 independent experiments, shown as dots. Data were normalised to Q15 vehicles samples. c Left: representative images of parental mouse ESCs or Q128 cells electroporated with PB vector encoding for GFP and Q128 cells electroporated with pGG134 vector, treated with MG132 for 5 days and stained with CV. Right: intensity of CV signal of surviving Q128_pGG134 colonies compared to Q128_GFP after mutagenesis and selection in presence of MG132 or Tamoxifen. Bars indicate the mean ± SEM of 4 independent experiments, shown as dots, normalised to Q128_GFP. P-values were calculated with a one-tailed one sample Mann-Whitney U test. d Steps for the identification of integration site in the MG15 clone by Splinkerette-PCR. The band corresponding to amplification of 5’ end (red dashed square) of the pGG134 in MG15, was excised, purified and sequenced. Each clone was analysed at least two times independently. The sequence obtained (top right) was then aligned to the mouse genome, allowing identification in the MG15 clone of PB vector insertion upstream of the Kdm5b gene (bottom panel). e Expression analysis by qPCR of Synj2, Kdm5b, Mtf1, Fbxo34 and Arid1b genes. Bars indicate the mean of 3 technical replicates shown as dots. Expression was normalised to the highest value. f Representative CV staining images of Q128 cells and 5 clones selected from Q128_pGG134 mutant population. g Western Blot confirmed HTT protein presence in all clones. Values shown below each clone are the mean of HTT intensity normalised to GAPDH intensity, used as loading control. Similar results were obtained in two additional technical replicates.
|