|
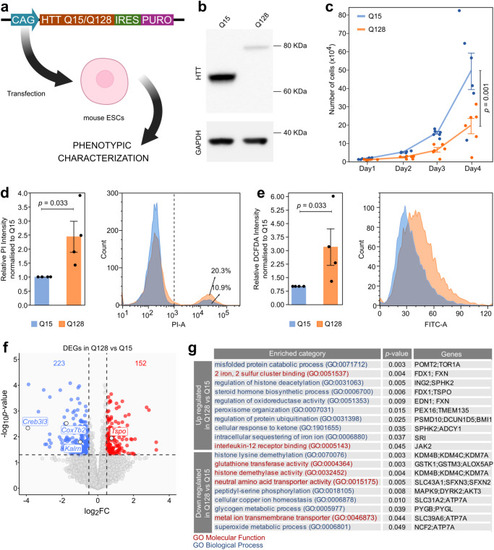
Establishment and characterisation of mHTT-expressing mouse ESCs. a Strategy for generation and characterisation of mouse ESCs (Rex1GFP-d2) expressing N-terminal fragment of either mutant (128 CAG repeats) or WT (15 CAG repeats) HTT by DNA transfection and puromycin selection, named Q15 and Q128 cells, respectively. Created with BioRender.com. b Western Blot for HTT confirmed the correct production of a 80 kDa and a 65 kDa form of HTT protein in Q128 and Q15 cells. GAPDH was used as loading control. The Western Blot shown is representative of 2 independent experiments with 2 technical replicates. c Proliferation assay of Q128 and Q15 cells. Lines indicate the mean ± standard error of the mean (SEM) of 6 independent experiments shown as dots. P-values were calculated with Two-way Repeated Measure ANOVA. d Measurement of cell death by PI uptake and Flow Cytometry. Left: the fraction of PI-positive cells (on the right of the dashed line) was calculated for each sample and fold-changes (FCs) were calculated relative to the Q15 samples. Bars indicate the mean ± SEM of 4 independent experiments shown as dots. Right: representative flow cytometry plots. P-values were calculated with one-tailed one sample Mann-Whitney U test. e Left: measurement of H2DCFDA median fluorescence as an evaluation of ROS production in Q15 versus Q128 cells. Bars indicate the mean ± SEM of 4 independent experiments shown as dots. FCs were calculated relative to the Q15 samples. Right: representative flow cytometry profiles. P-values were calculated with one-tailed one sample Mann-Whitney U test. f Transcriptome analysis of Q128 and Q15 cells. Down-regulated (log2 FC < −0.5 and p-value <0.05) and Up-regulated (log2 FC > 0.5 and p-value <0.05, indicated by dashed lines) genes are indicated in blue and red, respectively. P-values were calculated with two-tailed Wald Test with no adjustment. N = 6 biological replicates for Q15 and n = 7 for Q128 cells. g Gene list enrichment analysis of genes down- or up-regulated in Q128 cells, compared to Q15, identified in Fig. 1f. Categories from the Gene Ontology database for Biological processes or molecular functions are shown in blue or red, respectively. P-values were calculated by two-tailed Fisher Exact test using Enrichr software.
|