|
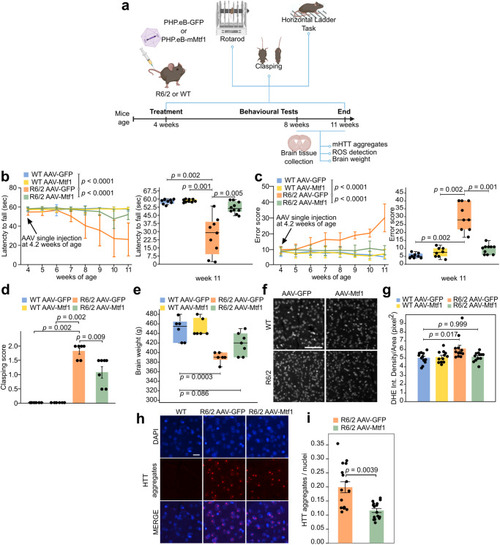
AAV-vector delivery of Mtf1 alleviates motor deficit in R6/2 mice. a Summary of experiments performed in HD mice injected with AAVs. Adapted from “Behavioural Tests for Mice - Timeline” by BioRender.com (2023). b Motor performance assessed by Rotarod test. Line plots show mean ± standard deviation (SD) of each experimental group at each time point. Two-way repeated measure ANOVA. Box plots of the indicated experimental groups at 11 weeks of age. Number of mice, shown as dots: WT AAV-GFP = 8; WT AAV-Mtf1 = 9; R6/2 AAV-GFP = 9; R6/2 AAV-Mtf1 = 10. Two-tailed Mann-Whitney U test with Bonferroni correction. c Analysis of motor coordination on Horizontal Ladder task. Line plots show mean ± SD. Two-way repeated measure ANOVA. Box plots of the indicated experimental groups at 11 weeks of age. Number of mice, shown as dots: WT AAV-GFP = 8; WT AAV-Mtf1 = 8; R6/2 AAV-GFP = 9; R6/2 AAV-Mtf1 = 10. Two-tailed Mann-Whitney U test with Bonferroni correction. d Limb-clasping response at 7-8 weeks of age. Bars indicate the mean ± SD. N = 6 mice for each group. Two-tailed Wilcoxon test. e Brain weight measure. Number of mice, shown as dots: WT AAV-GFP = 6; WT AAV-Mtf1 = 6; R6/2 AAV-GFP = 6; R6/2 AAV-Mtf1 = 7. Values round off to the nearest 10 to account for minor differences in the dissection procedure. Two-way ANOVA with Bonferroni correction. f Detection of superoxide production by DHE. Representative images from 4 biological replicates. Scale bar, 50 μm. g Normalised DHE staining intensity. Bars indicate the mean ± SD. N = 4 mice for each group. N = 3 measurements for each mouse, shown as dots. Two-way ANOVA with Bonferroni correction. h Immunohistochemistry of the striatum of WT and R6/2 mice injected with either AAV-GFP or AAV-Mtf1 stained with EM48 antibody, which specifically detects mHTT aggregates. DAPI was used to detect nuclei. Scale bar, 10 μm. i Bars indicate the mean ± SD of the number of nuclear mHTT aggregates counted in 4 different levels for each animal of each group, shown as dots. N = 4 mice from each group were analysed. Two-tailed Mann-Whitney test. All box plots indicate 1st, 2nd and 3rd quartile; whiskers indicate minimum and maximum.
|