|
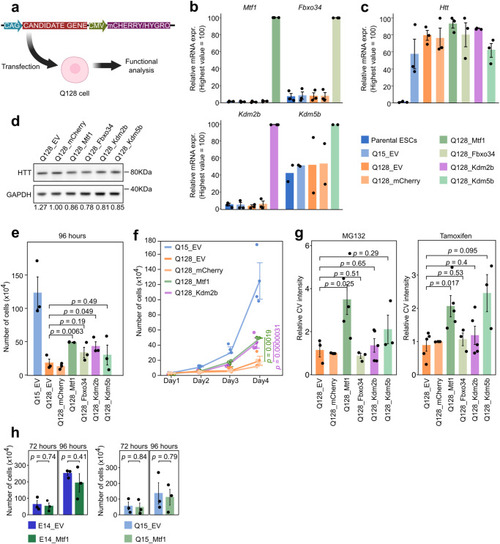
Secondary validation of mHTT suppressors. a Diagram of the secondary validation experiments: the cDNA of candidate genes was stably expressed in Q128 cells. An empty vector (EV) and a vector containing only mCherry cDNA served as negative controls. Created with BioRender.com. b Gene expression analysis by qPCR of Mtf1, Kdm2b, Kdm5b and Fbxo34 confirmed increased levels of genes in corresponding cell lines in which they were overexpressed. Bars indicate the mean ± SEM of 3 independent experiments (Mtf1, Fbxo34, Kdm2b) and 2 independent experiments (Kdm5b) shown as dots. Expression was normalised to the highest value. c qPCR analyses for HTT mRNA. Bars indicate the mean ± SEM of 3 independent experiments shown as dots. Expression was normalised to the highest value. d Western Blot analyses of HTT protein in Q128 cells transfected with different constructs. GAPDH was used as loading control. Values shown below lane are the mean of n = 3 technical replicates of HTT intensity normalised to GAPDH intensity. e Proliferation assay results at 96 hours of the indicated cell lines. Bars indicate the mean ± SEM of 3 independent experiments, shown as dots. P-values were calculated with unpaired two-tailed t-test, comparing each candidate to the Q128_EV sample. f Proliferation assay of the indicated cell lines. Bars indicate the mean ± SEM of 3 independent experiments, shown as dots. P-values were calculated with Two-way Repeated Measure ANOVA, comparing each candidate to the Q128_EV sample. g CV quantification showing the number of surviving colonies in Q128_Mtf1, Q128_Kdm5b and Q128_Fbxo34 cells after 48 hours of treatments with MG132 (left panel) or Tamoxifen (right panel), compared to the Q128 cell lines. Bars indicate the mean values ± SEM from at least 3 independent experiments. P-values were calculated with unpaired two-tailed t-test, comparing each candidate to the Q128_EV sample. h Proliferation assay at 72 and 96 hours for parental ESCs (E14) and Q15 cells, expressing either an EV or Mtf1. Bars indicate the mean ± SEM of 3 independent experiments, shown as dots. P-values were calculated with unpaired two-tailed t-test, comparing each candidate EV sample.
|