IMAGE

Fig. 8

ID
ZDB-IMAGE-230707-18
Source
Figures for Ferlazzo et al., 2023
Image
Figure Caption

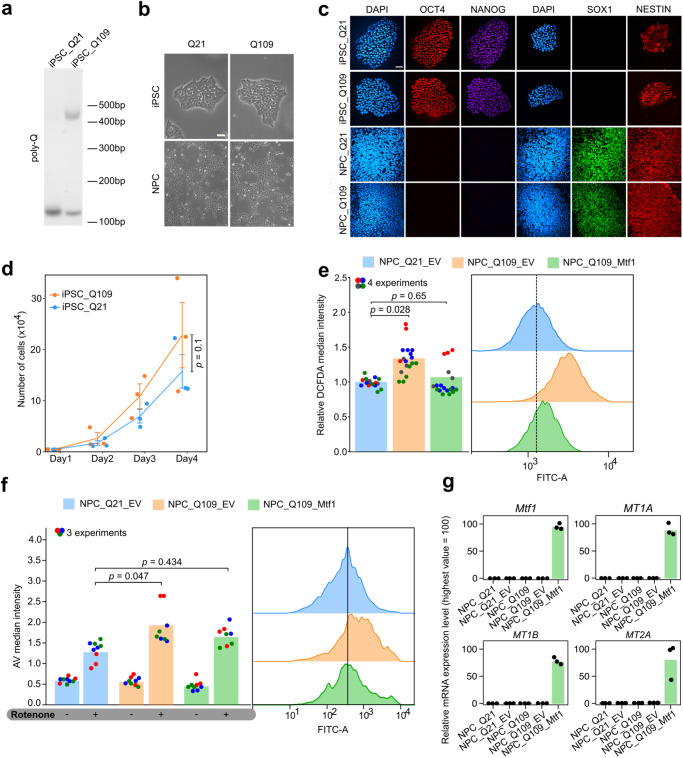
Fig. 8 MTF1 rescues mHTT-dependent alterations in human NPCs.

a Genotyping of iPSC_Q21 and Q109 showed two amplicons for Q109 cell line (143 bp corresponds to WT allele with 19 CAG repeats, 470 bp corresponds to mutated allele with 109 CAG repeats), versus two overlapping bands in Q21 cell line. β-Actin was used as loading control. n = 1 experiment. b Brightfield images showing the morphology of iPSC_Q21, iPSC_Q109, NPC Q21, NPC Q109. Scale bar, 20 µm. Similar results were obtained in 7 independent experiments. c Immunofluorescence for pluripotency markers OCT4 and NANOG and early neural markers SOX1 and NESTIN of iPSC_Q21, iPSC_Q109, NPC_Q21, NPC_Q109. Scale bar, 40 µm. Similar results were obtained in 3 independent experiments. d Proliferation assay of iPSC_Q109 (orange) and iPSC_Q21 (blue) cells. Bars indicate the mean ± SEM of 3 independent experiments, shown as dots. P-value was calculated with Two-way Repeated Measure ANOVA. e Measurement of H2DCFDA fluorescence as an evaluation of ROS production in NPC_Q21_EV versus NPC_Q109_EV, NPC_Q109_Mtf1 cells. Representative flow cytometry profiles of ROS detection in NPC_Q21_EV, NPC_Q109_EV and NPC_Q109_Mtf1 are represented in the right panels. Bars indicate the mean of 4 independent experiments. For each experiment, technical replicates are shown as dots of different colours. FCs were calculated relative to the NPC_Q21_EV samples. P-values were calculated with unpaired two-tailed t-test. f Measurement of cell death by Annexin V uptake and Flow Cytometry. The fraction of Annexin V positive cells was calculated for each sample and FCs were calculated relative to the NPC_Q21_EV samples. Representative flow cytometry profiles of AV detection in NPC_Q21_EV, NPC_Q109_EV and NPC_Q109_Mtf1 are represented in the right panels. Bars indicate the mean of 3 independent experiments shown as dots (technical replicates of different experiments are presented with different colours). P-values were calculated with One-way Repeated Measure ANOVA with Tukey’s correction. g Gene expression analysis by qPCR of Mtf1 and metallothioneins MT1A, MT1B, MT2A in the indicated samples. N = 3 technical replicates, shown as dots. Expression was normalised to the highest value. Numerical values are provided in the Source data file.

Acknowledgments
This image is the copyrighted work of the attributed author or publisher, and ZFIN has permission only to display this image to its users. Additional permissions should be obtained from the applicable author or publisher of the image. Full text @ Nat. Commun.