FIGURE SUMMARY
Title

The Nature and Origin of Synaptic Inputs to Vestibulospinal Neurons in the Larval Zebrafish

Authors
Hamling, K.R., Harmon, K., Schoppik, D.
Source
Full text @ eNeuro

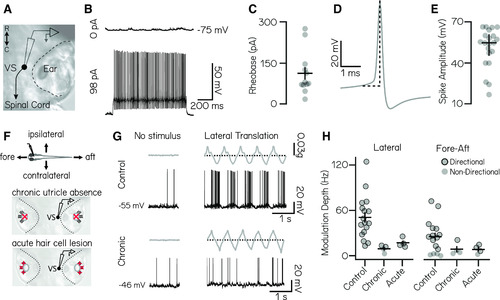
Vestibulospinal neurons encode utricle-derived body translation. A, Schematic of spinal-projecting vestibulospinal (VS) neuron targeted for electrophysiology. B, Vestibulospinal membrane potential at rest (top, 0 pA) and in response to current injection (bottom, 98 pA). C, Rheobase (mean ± SEM) across 12 nonspontaneously active cells. D, Example action potential waveform with amplitude (dotted line). E, Action potential average amplitude (median ± interquartile range) across 21 cells. F, Immobilized fish were manually translated in the fore–aft or lateral axes (top). Vestibulospinal neurons were recorded in control and after two manipulations: first, in otogelin mutants (middle) that do not develop utricles (red “x”) and second, after chemically induced hair cell (red “x”) death (bottom). G, Accelerometer (gray) and voltage trace (black) from a neuron in a control fish (top) showing action potentials in phase with translation. In contrast, activity from an otogelin mutant (bottom) is unaligned with translation. H, Modulation depth of spiking response (mean ± SEM) is disrupted in both the lateral (left) and fore–aft (right) directions after both chronic and acute disruption of the utricle. Gray circles, neurons; black outlined circles, statistically significant directional responses.

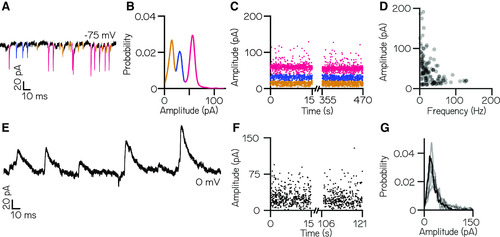
Larval zebrafish vestibulospinal neurons receive dense spontaneous synaptic input. A, Distinct amplitudes (color) in spontaneous EPSCs from a neuron held at –75 mV. B, EPSC amplitudes from a single vestibulospinal neuron show three distinct probability peaks, or “bins” (color). C, EPSC bins are stationary in time. D, EPSC amplitude as a function of frequency for all bins in all vestibulospinal neurons (115 bins, from 35 cells). E, Representative current trace from a vestibulospinal neuron held at 0 mV. F, IPSC amplitudes over time. G, IPSC amplitudes for the example neuron in panels E–F (black line) and other neurons (gray lines) do not show multiple peaks (n = 5).

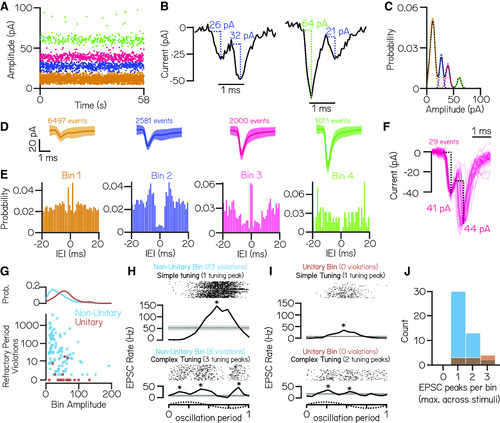
EPSC events within the same amplitude bin predominantly reflect multiple neuronal inputs. A, An example cell with four stable and discrete amplitude bins (colored by bin). B, Example EPSC traces demonstrate events that co-occur within 1 ms. Event pairs are either within-bin (left) or across-bin (right). C, To estimate an upper limit on the expected refractory period violations because of bin overlap, EPSC amplitude distributions were modeled as a sum of individual Gaussians (dashed colored lines). D, Average waveforms from each EPSC bin (±SD; n = 6497, 2581, 2000, and 1011 events/bin). E, Autocorrelograms show structure of interevent intervals within an EPSC bin; note peaks near zero in bins 1 and 3, a nonzero valley for bin 2, and a true valley for the high-amplitude bin 4. F, Waveforms from EPSC pairs within bin 3 with latencies <1 ms (n = 29 event pairs). The large jitter between peaks is inconsistent with the expected profile of an electrochemical synapse. G, Observed within-bin refractory period violations as a function of bin amplitude for bins assigned as having nonunitary (blue) or unitary (brown) origin. The probability distribution of bin amplitudes is shown above. H, I, EPSC event timing from two example nonunitary (H) or unitary (I) bins aligned to one oscillation of lateral translation. EPSCs within a single bin can exhibit simple tuning with a single peak in EPSC rate (top) or can have complex tuning with multiple peaks in EPSC rate during oscillation (bottom). Asterisks indicate EPSC tuning peaks. J, Histogram of the number of EPSC rate peaks per amplitude bin during translation (maximum per bin across lateral and fore–aft stimuli) for nonunitary and unitary EPSC bins.

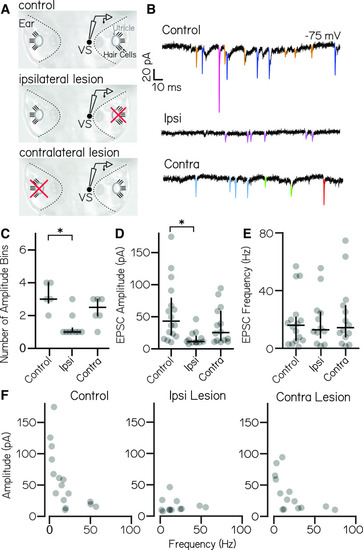
High-amplitude spontaneous excitatory inputs originate in the ipsilateral ear. A, Lesion schematic: the utricle (gray circle) was physically removed (red “x”) either ipsilateral or contralateral to the recorded vestibulospinal neuron (black circle, “VS”). B, Example current traces from neurons held at −75 mV from control (top), ipsilateral (middle), and contralateral (bottom) experiments; EPSCs are in color. C, Number of EPSC amplitude bins per cell [median ± interquartile range (IQR) in black] is decreased after ipsilateral, but not contralateral, lesion. Asterisks indicate statistically significant differences (p < 0.05). D, EPSC bin amplitudes (median ± IQR in black) are decreased after ipsilateral, but not contralateral, lesion. E, Frequency of events in EPSC bins (median ± IQR in black) is unchanged after ipsilateral or contralateral lesion compared with control cells. F, EPSC amplitude versus frequency for each bin in control and after ipsilateral/contralateral lesions. High-amplitude bins are lost after ipsilateral lesion.

Inhibitory current inputs have ipsilateral and contralateral vestibular sensory origins. A, Control trace from a neuron held at 0 mV shows inhibitory input at rest (top). After ipsilateral (middle) or contralateral (bottom) utricular lesion, some cells experience strong loss of inhibitory currents, while others appear unaffected. B, Distribution of IPSC frequency after ipsilateral or contralateral utricular lesions. Symbols correspond with example neurons in A. Control neurons (n = 5) experienced IPSC frequency from 13.7 to 32.5 Hz. After ipsilateral lesions, 4 of 8 neurons experienced IPSC frequencies <2 SDs below control (under 7.5 Hz, symbols outlined in black). After contralateral lesion, 2 of 6 neurons received IPSCs <7.5 Hz. C, IPSC amplitude is unchanged across control and lesion conditions (mean ± SEM).

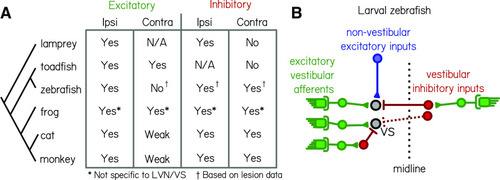
Comparative synaptic architecture of zebrafish vestibulospinal neurons. A, Summary of previous circuit mapping of functional synaptic connections between vestibular afferents and secondary vestibular neurons across species [lamprey (Rovainen, 1979); toadfish (Korn et al., 1977); zebrafish (Liu et al., 2020; current study); frog (Ozawa et al., 1974; Holler and Straka, 2001; Pfanzelt et al., 2008; Malinvaud et al., 2010); cat (Shimazu and Smith, 1971; Uchino et al., 1999, 2001; Kushiro et al., 2000; Ogawa et al., 2000); and monkey (Goldberg et al., 1987; Highstein et al., 1987)]. All characterizations were from vestibulospinal neuron homologs, except for the frog (asterisk) where data were not specific to vestibulospinal neurons in the lateral vestibular nucleus. Connections were determined by afferent activation, except where only afferent lesion data from the current study were available (dagger). B, Vestibulospinal neurons (“VS”, black circles) receive convergent high-amplitude excitatory inputs (green) from irregular afferents originating with the ipsilateral utricle (see also Liu et al., 2020), low-amplitude excitatory inputs (blue) from extravestibular sources and inhibitory inputs (red) from either the ipsilateral or contralateral utricle.

Acknowledgments
This image is the copyrighted work of the attributed author or publisher, and ZFIN has permission only to display this image to its users. Additional permissions should be obtained from the applicable author or publisher of the image. Full text @ eNeuro