IMAGE

Figure 2.

ID
ZDB-IMAGE-230606-21
Source
Figures for Hamling et al., 2023
Image
Figure Caption

Figure 2.

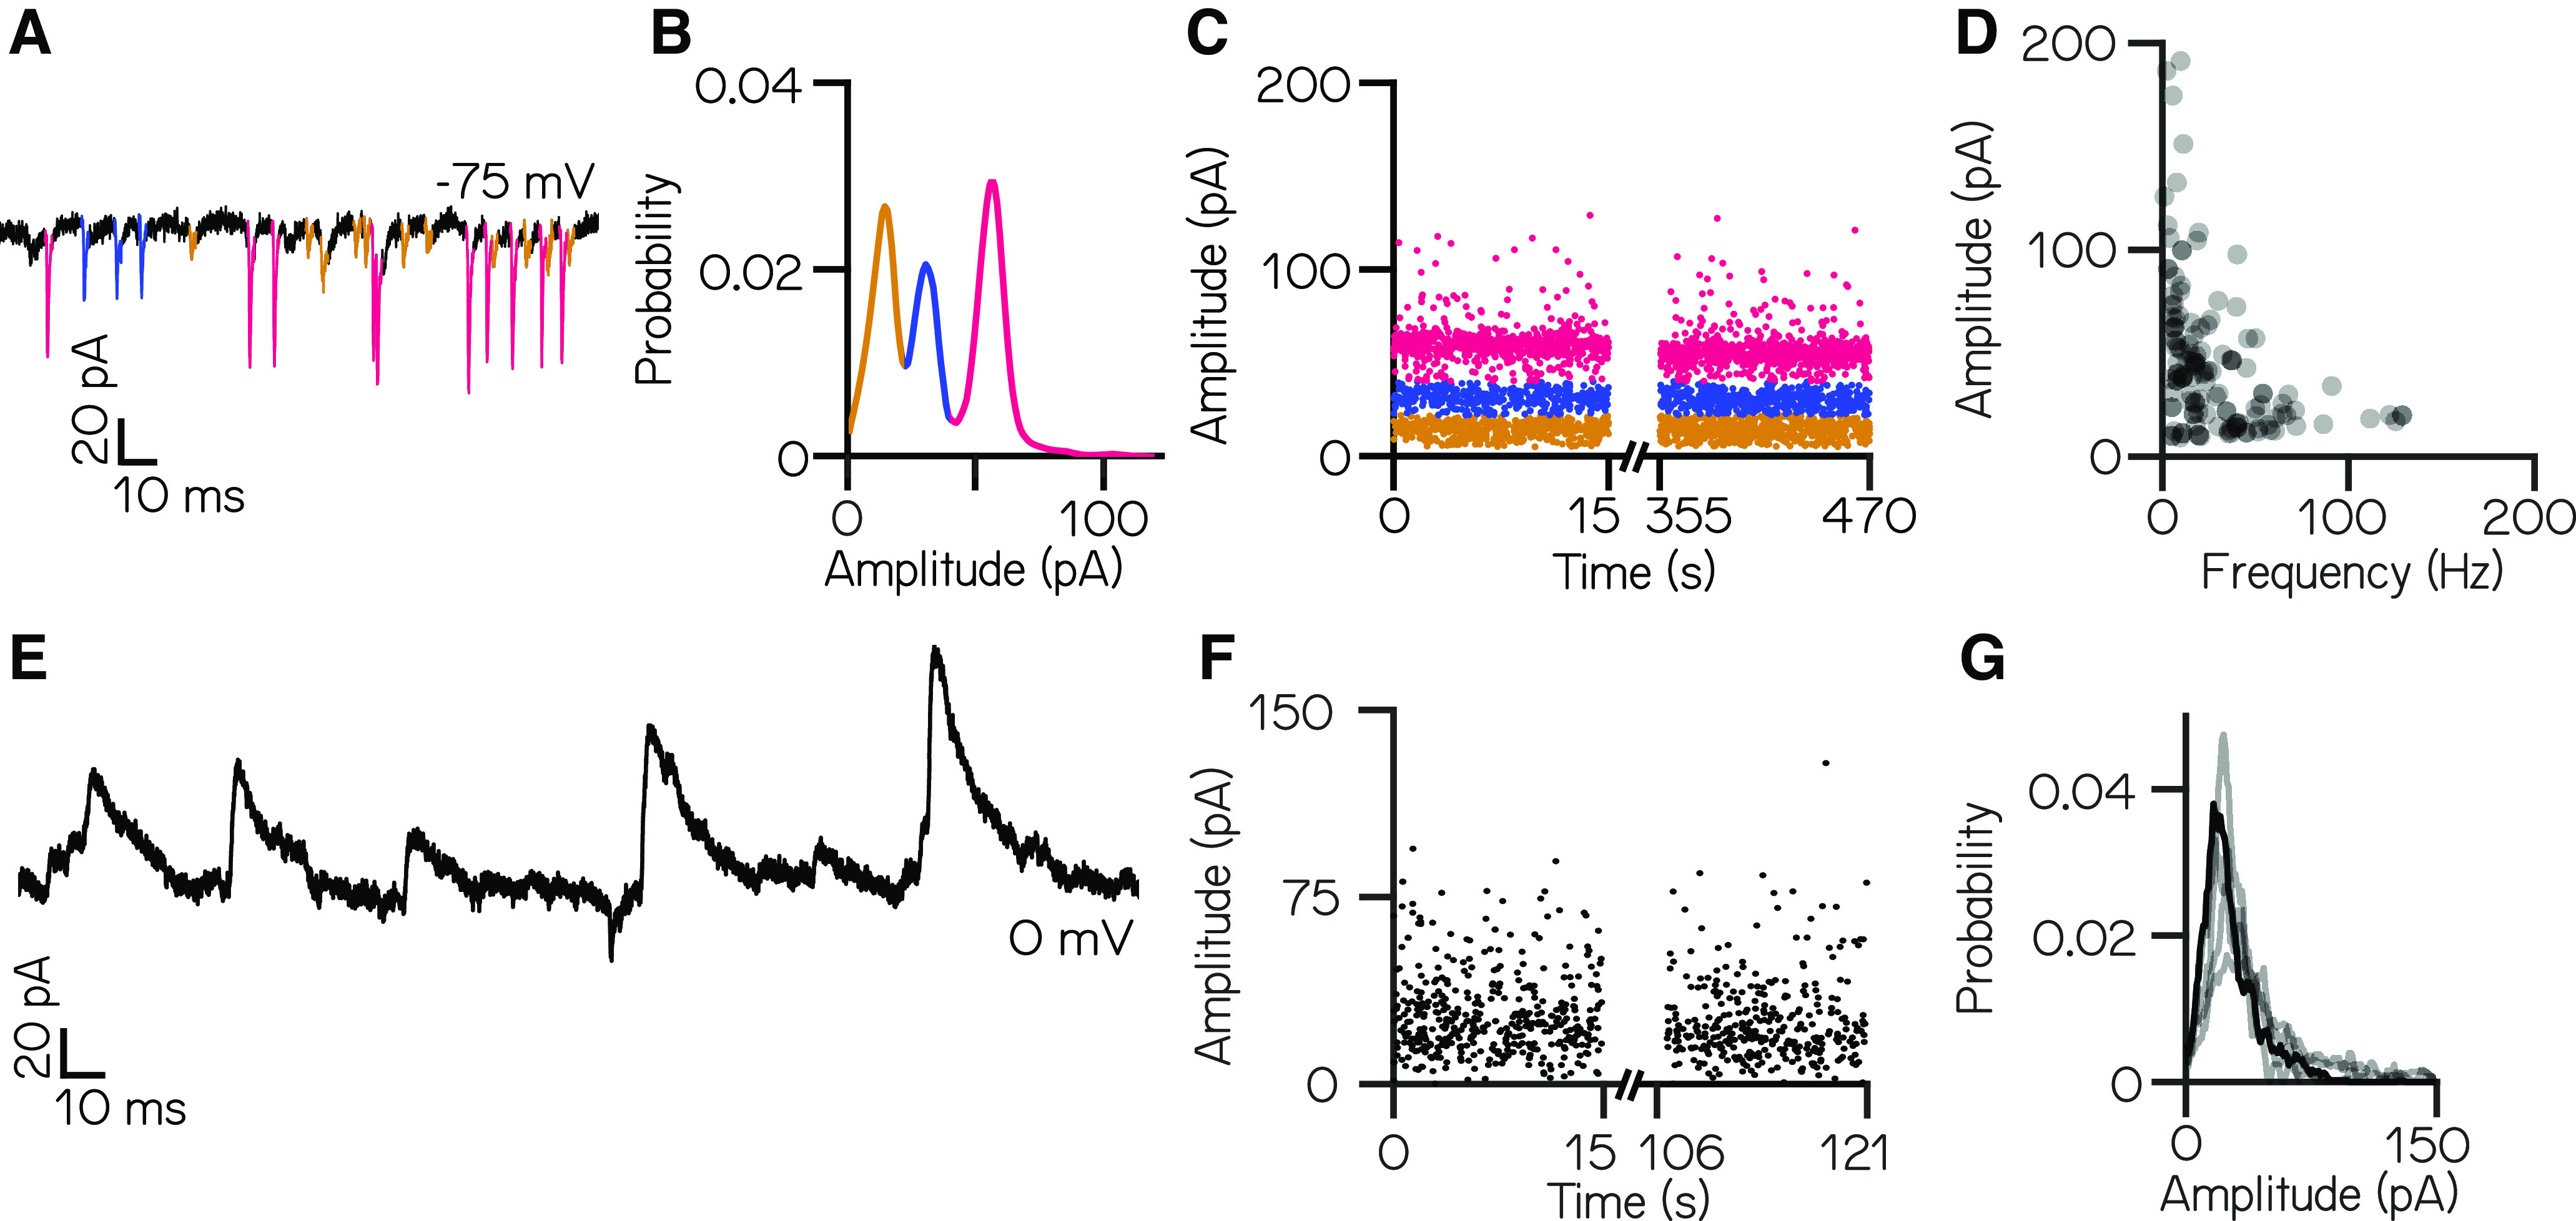
Larval zebrafish vestibulospinal neurons receive dense spontaneous synaptic input. A, Distinct amplitudes (color) in spontaneous EPSCs from a neuron held at –75 mV. B, EPSC amplitudes from a single vestibulospinal neuron show three distinct probability peaks, or “bins” (color). C, EPSC bins are stationary in time. D, EPSC amplitude as a function of frequency for all bins in all vestibulospinal neurons (115 bins, from 35 cells). E, Representative current trace from a vestibulospinal neuron held at 0 mV. F, IPSC amplitudes over time. G, IPSC amplitudes for the example neuron in panels E–F (black line) and other neurons (gray lines) do not show multiple peaks (n = 5).

Acknowledgments
This image is the copyrighted work of the attributed author or publisher, and ZFIN has permission only to display this image to its users. Additional permissions should be obtained from the applicable author or publisher of the image. Full text @ eNeuro