IMAGE

Figure 5.

ID
ZDB-IMAGE-230606-24
Source
Figures for Hamling et al., 2023
Image
Figure Caption

Figure 5.

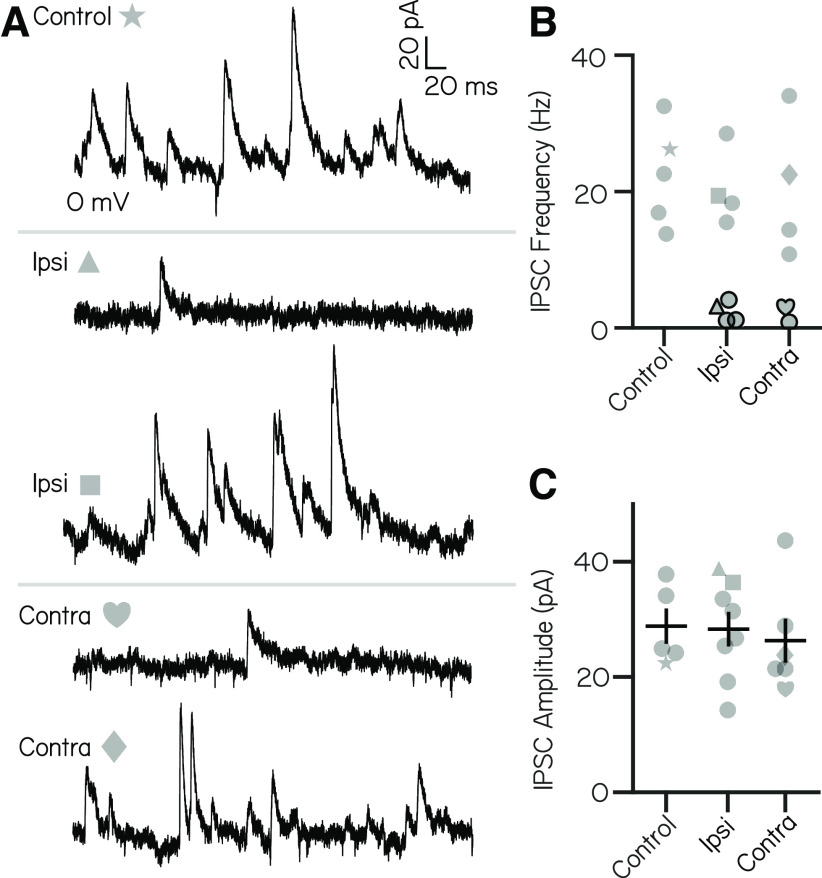
Inhibitory current inputs have ipsilateral and contralateral vestibular sensory origins. A, Control trace from a neuron held at 0 mV shows inhibitory input at rest (top). After ipsilateral (middle) or contralateral (bottom) utricular lesion, some cells experience strong loss of inhibitory currents, while others appear unaffected. B, Distribution of IPSC frequency after ipsilateral or contralateral utricular lesions. Symbols correspond with example neurons in A. Control neurons (n = 5) experienced IPSC frequency from 13.7 to 32.5 Hz. After ipsilateral lesions, 4 of 8 neurons experienced IPSC frequencies <2 SDs below control (under 7.5 Hz, symbols outlined in black). After contralateral lesion, 2 of 6 neurons received IPSCs <7.5 Hz. C, IPSC amplitude is unchanged across control and lesion conditions (mean ± SEM).

Acknowledgments
This image is the copyrighted work of the attributed author or publisher, and ZFIN has permission only to display this image to its users. Additional permissions should be obtained from the applicable author or publisher of the image. Full text @ eNeuro