
- Title
-
Loss of threonyl-tRNA synthetase-like protein Tarsl2 has little impact on protein synthesis but affects mouse development
- Authors
- Zeng, Q.Y., Zhang, F., Zhang, J.H., Hei, Z., Li, Z.H., Huang, M.H., Fang, P., Wang, E.D., Sun, X.J., Zhou, X.L.
- Source
- Full text @ J. Biol. Chem.
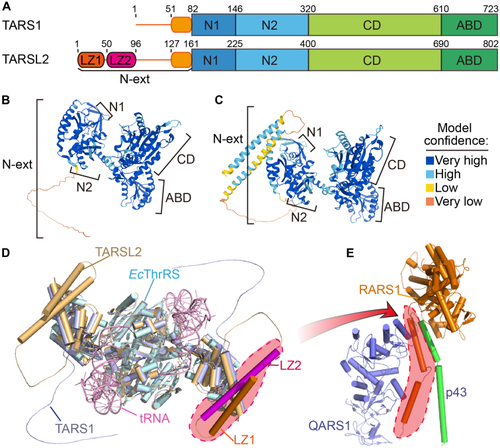
The topology of TARSL2 in the N-terminal extension differs from that of TARS1.A, the domains of TARS1 and TARSL2. B, the TARS1 structure model was predicted by AlphaFold 2. C, the TARSL2 structure model was predicted by AlphaFold 2. In (B and C), the structures are colored on the basis of the confidence of each model prediction. D, the structural models of TARS1 and TARS2 are superimposed onto the E. coli ThrRS-tRNA structure (PDB ID 1QF6). TARS1 is light blue. TARSL2 is wheat; however, the leucine zippers in one chain are highlighted in orange and magenta. E. coli ThrRS is cyan, and tRNA is pink. E, the leucine zippers of RARS1 are highlighted with a red dashed line in the RARS1–QARS1–p43 complex structure (PDB ID 4R3Z). ABD, anticodon binding domain; CD, catalytic domain; LZ, leucine zipper; N-ext, N-terminal extension; ThrRS, threonyl-tRNA synthetase. |
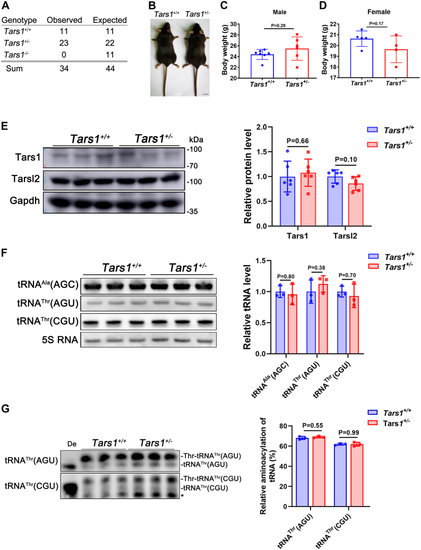
Tars1 is indispensable in vivo.A, statistical analysis showing the genetic features of the Tars1-KO mice (n = 34). B, body features of the 10-week-old Tars1+/+ and Tars1+/− mice. The scale bar represents 1 cm. C, statistical analysis showing the weights of the 16-week-old Tars1+/+ (n = 7) and Tars1+/− (n = 6) male mice. D, statistical analysis showing the weights of the 16-week-old Tars1+/+ (n = 5) and Tars1+/− (n = 4) female mice. E, protein abundance of the 8-week-old Tars1 and Tarsl2 in Tars1+/+ and Tars1+/− mouse muscle as detected by Western blot. Gapdh was used as the loading control. F, levels of tRNAAla(AGC), tRNAThr(AGU), and tRNAThr(CGU) in muscle tissues of the 8-week-old Tars1+/+ and Tars1+/− mice. 5S RNA was as the loading control. G, aminoacylation levels of tRNAThr(AGU) and tRNAThr(CGU) in muscle tissues of the 8-week-old Tars1+/+ and Tars1+/− mice. ∗, a nonspecific band. De: tRNA deaminoacylation control. Error bars in (C–G) represent the mean ± SD with the p values indicated (two-tailed Student’s t test). |
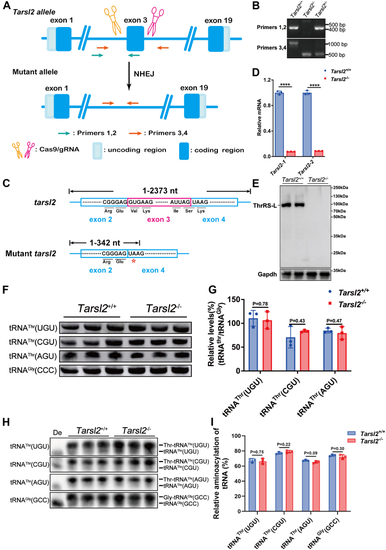
Loss of Tarsl2 exerts no effect on the steady-state or charging of tRNAThrs in vivo.A, schematic showing Tarsl2-mutant mouse construction by CRISPR/Cas9 gene editing technology. Two sgRNAs were designed around exon 3 to delete a sequence fragment. Primers 1 and 2 and Primers 3 and 4 were used to detect DNA mutations. B, PCR detection of the Tarsl2+/+, Tarsl2+/−, and Tarsl2−/− mouse genotypes using Primers 1 and 2 and Primers 3 and 4. C, sequencing results of Tarsl2+/+ and Tarsl2−/− mice. In the mutant mice, Tarsl2 mRNA translation was prematurely terminated at nt 342. D, Tarsl2 mRNA levels in the muscle of the 6-week-old Tarsl2+/+ and Tarsl2−/− mice, as determined by RT‒PCR with two pairs of primers. E, protein abundance of Tarsl2 in the 6-week-old Tarsl2+/+ and Tarsl2−/− mouse muscle, as detected by Western blotting. Gapdh was used as the loading control. F and G, levels of tRNAThr(UGU), tRNAThr(CGU), and tRNAThr(AGU) in the muscle tissues of the 6-week-old Tarsl2+/+ and Tarsl2−/− mice. tRNAGly(CCC) was included as the loading control. H and I Aminoacylation levels of tRNAThr(UGU), tRNAThr(CGU), and tRNAThr(AGU) in the muscle tissues of the 6-week-old |
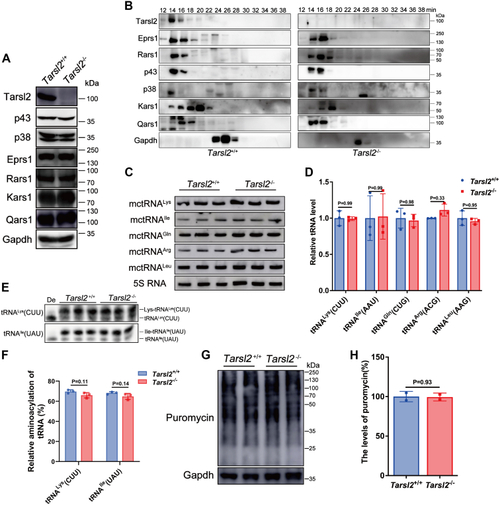
Deletion of Tarsl2 exerts no effect on MSC integrity or tRNA aminoacylation in vivo.A, protein levels of various MSC components in the 6-week-old Tarsl2+/+ and Tarsl2−/− mouse muscle. B, incorporation of several MSC components in the 6-week-old Tarsl2+/+ and Tarsl2−/− mouse muscle lysates. C and D, levels of tRNAs [tRNALys(CUU), tRNAIle(AAU), tRNAGln(CUG), tRNAArg(ACG), and tRNALeu(AAG)] in the 6-week-old Tarsl2+/+ and Tarsl2−/− mouse muscle. E and F, aminoacylation levels of tRNALys(CUU) and tRNAIle(UAU) in the 6-week-old Tarsl2+/+ and Tarsl2−/− mouse muscle. De: tRNA deaminoacylation control. G and H, global protein synthesis rate of the 6-week-old Tarsl2+/+ and Tarsl2−/− mouse MEFs, as determined by puromycin incorporation assay. Gapdh was included as the loading control. Error bars in (D, F, and H) represent the mean ± SD with the p values indicated (two-tailed Student’s t test). MEF, mouse embryonic fibroblast; MSC, multiple tRNA synthetase complex. |
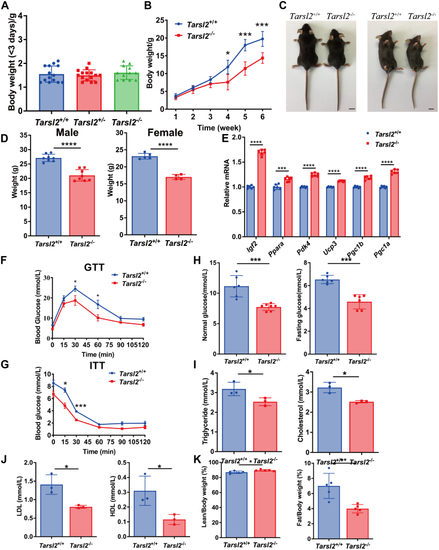
Deletion of Tarsl2 affects mouse growth and metabolism. A, weight of Tarsl2+/+ (n = 14), Tarsl2+/− (n = 15), and Tarsl2−/− (n = 12) mice within 3 days of birth. B, growth curves of Tarsl2+/+ (n = 13) and Tarsl2−/− mice (n = 3). C, body features of 10-week-old Tarsl2+/+ and Tarsl2−/− mice. The scale bar represents 1 cm. D, statistical analysis showing the weights of the 16-week-old Tarsl2+/+ (n = 8) and Tarsl2−/− (n = 8) male (left) and Tarsl2+/+ (n = 5) and Tarsl2−/− (n = 4) female (right) mice. E, relative RNA levels of several metabolism-related genes in the 6-week-old Tarsl2+/+ and Tarsl2−/− mouse muscle, as detected by RT‒PCR. F, blood glucose levels in the 6-week-old Tarsl2+/+ (n = 8) and Tarsl2−/− (n = 5) mice after 16 h of starvation, as determined by GTT. G, blood glucose levels of the 6-week-old Tarsl2+/+ (n = 3) and Tarsl2−/− (n = 3) mice after 5 h of starvation, as detected by ITT. H, blood glucose levels of the 6-week-old Tarsl2+/+ (n = 6) and Tarsl2−/− (n = 7) mice were detected after satiety (left) and after 16 h of starvation (right). I, levels of triglyceride (left) and cholesterol (right) in the blood of the 6-week-old Tarsl2+/+ (n = 3) and Tarsl2−/− (n = 3) mice. J, levels of LDL (left) and HDL (right) in the blood of the 6-week-old Tarsl2+/+ (n = 3) and Tarsl2−/− (n = 3) mice. K, body fat percentage of the 6-week-old Tarsl2+/+ (n = 5) and Tarsl2−/− (n = 5) mice, measured on the basis of fat/body weight (left) and lean body weight (right). ∗∗∗∗p < 0.0001, ∗∗∗p < 0.001, ∗∗p < 0.01 and ∗p < 0.05. The error bar represents the mean ± SD with the p values indicated (two-tailed Student’s t test). |
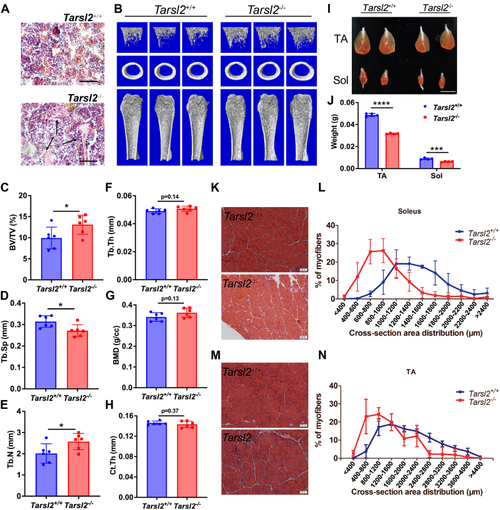
Tarsl2 deletion affects the development of bone and muscle. |
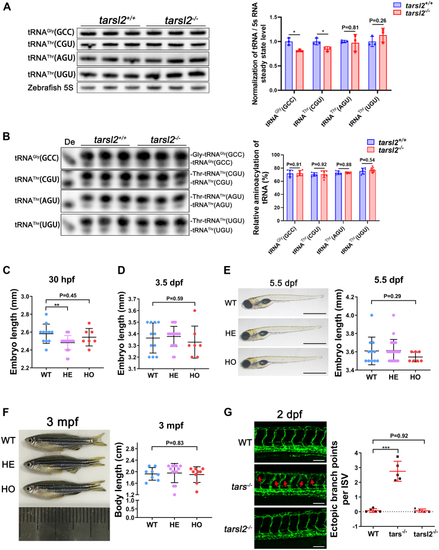
The tarsl2-null zebrafish display a normal phenotype.A, levels of tRNA Gly(GCC), tRNAThr(CGU), tRNAThr(AGU), and tRNAThr(UGU) in WT and tarsl2−/− zebrafish embryos, with quantification shown on the right. Zebrafish 5S RNA was included as the loading control. B, aminoacylation levels of tRNAGly(GCC), tRNAThr(CGU), tRNAThr(AGU), and tRNAThr(UGU) in WT and tarsl2−/− zebrafish embryos, with the quantification analysis results shown on the right. De: tRNA deaminoacylation control. C and D, quantification analysis showing the body length of the WT, tarsl2+/− and tarsl2−/− embryos 30 hpf (C) and 3 dpf (D). E, images showing the body length of the WT, tarsl2+/− and tarsl2−/− embryos 5.5 dpf on the left, with quantification analysis shown on the right. The scale bar reprents 1 mm. F, representative images (left) and quantification (right) results showing the body length of the WT, tarsl2+/− and tarsl2−/− zebrafish 3 mpf. G, representative confocal microscopy images (left) and quantification analysis (right) of the ectopic branch points per ISV of the WT, tars−/− and tarsl2−/− embryos two dpf. The scale bar represents 100 μm. ∗∗p < 0.01 and ∗∗∗p < 0.001. The error bar represents the mean ± SD with the p values indicated (two-tailed Student’s t test). |