
Figure 5
- ID
- ZDB-FIG-230526-66
- Publication
- Zeng et al., 2023 - Loss of threonyl-tRNA synthetase-like protein Tarsl2 has little impact on protein synthesis but affects mouse development
- Other Figures
- All Figure Page
- Back to All Figure Page
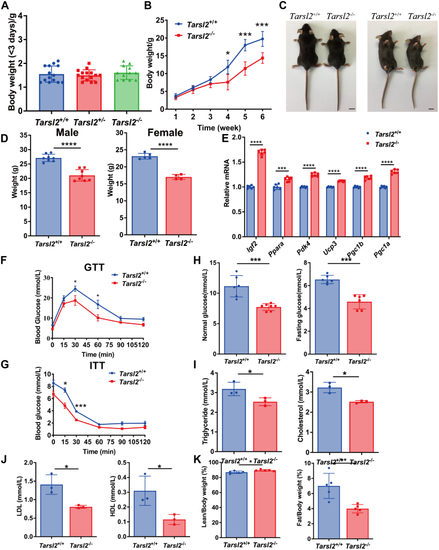
Deletion of Tarsl2 affects mouse growth and metabolism. A, weight of Tarsl2+/+ (n = 14), Tarsl2+/− (n = 15), and Tarsl2−/− (n = 12) mice within 3 days of birth. B, growth curves of Tarsl2+/+ (n = 13) and Tarsl2−/− mice (n = 3). C, body features of 10-week-old Tarsl2+/+ and Tarsl2−/− mice. The scale bar represents 1 cm. D, statistical analysis showing the weights of the 16-week-old Tarsl2+/+ (n = 8) and Tarsl2−/− (n = 8) male (left) and Tarsl2+/+ (n = 5) and Tarsl2−/− (n = 4) female (right) mice. E, relative RNA levels of several metabolism-related genes in the 6-week-old Tarsl2+/+ and Tarsl2−/− mouse muscle, as detected by RT‒PCR. F, blood glucose levels in the 6-week-old Tarsl2+/+ (n = 8) and Tarsl2−/− (n = 5) mice after 16 h of starvation, as determined by GTT. G, blood glucose levels of the 6-week-old Tarsl2+/+ (n = 3) and Tarsl2−/− (n = 3) mice after 5 h of starvation, as detected by ITT. H, blood glucose levels of the 6-week-old Tarsl2+/+ (n = 6) and Tarsl2−/− (n = 7) mice were detected after satiety (left) and after 16 h of starvation (right). I, levels of triglyceride (left) and cholesterol (right) in the blood of the 6-week-old Tarsl2+/+ (n = 3) and Tarsl2−/− (n = 3) mice. J, levels of LDL (left) and HDL (right) in the blood of the 6-week-old Tarsl2+/+ (n = 3) and Tarsl2−/− (n = 3) mice. K, body fat percentage of the 6-week-old Tarsl2+/+ (n = 5) and Tarsl2−/− (n = 5) mice, measured on the basis of fat/body weight (left) and lean body weight (right). ∗∗∗∗p < 0.0001, ∗∗∗p < 0.001, ∗∗p < 0.01 and ∗p < 0.05. The error bar represents the mean ± SD with the p values indicated (two-tailed Student’s t test). |