IMAGE

Figure 6

ID
ZDB-IMAGE-230526-67
Source
Figures for Zeng et al., 2023
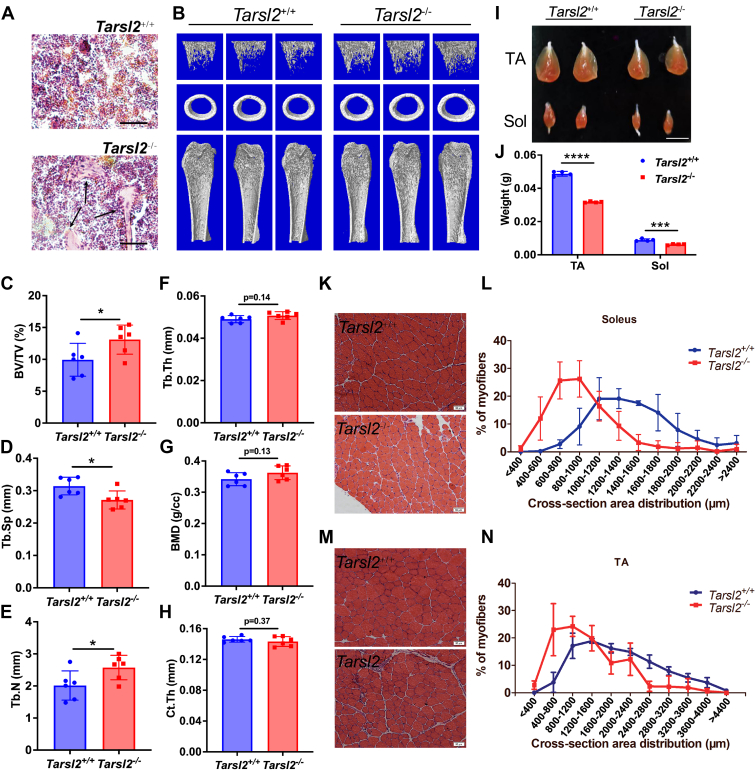
Image
Figure Caption

Figure 6

Tarsl2 deletion affects the development of bone and muscle.A, H&E staining of bone sections from 8-week-old Tarsl2+/+ and Tarsl2−/− mice. The black arrow indicates the abnormal trabeculae in the tibia of the Tarsl2−/− mice. The scale bar represents 40 mm. B, three-dimensional μ-CT images of the trabecular bone in distal femurs isolated from 8-week-old male Tarsl2+/+ and Tarsl2−/− mice (n = 6). CH, the μ-CT results in (B) were quantitatively analyzed to determine bone volume fraction (BV/TV), trabecular thickness (Tb.Th), the number of trabeculae (TB.N), the separation of trabeculae (Tb.Sp), bone mineral density (BMD), and cortical bone thickness (Ct.Th) (n = 6). I, comparisons of the tibialis anterior muscle and soleus muscle between the 6-week-old Tarsl2+/+ and Tarsl2−/− mice. The scale bar represents 1 cm. J, the weight of the TA and soleus muscle of the Tarsl2+/+ and Tarsl2−/− mice in (I) was measured. K, H&E staining of soleus cross sections from 6-week-old Tarsl2+/+ and Tarsl2−/− mice. L, area of the soleus cross section from Tarsl2+/+ and Tarsl2−/− mice. M, H&E staining of TA cross sections from 6-week-old Tarsl2+/+ and Tarsl2−/− mice. N, area of TA cross sections of Tarsl2+/+ and Tarsl2−/− mice. ∗∗∗∗p < 0.0001, ∗∗∗p < 0.001, and ∗p < 0.05. The error bar represents the mean ± SD with the p values indicated (two-tailed Student’s t test). TA, tibialis anterior.

Acknowledgments
This image is the copyrighted work of the attributed author or publisher, and ZFIN has permission only to display this image to its users. Additional permissions should be obtained from the applicable author or publisher of the image. Full text @ J. Biol. Chem.