
Figure 1
- ID
- ZDB-IMAGE-230526-62
- Publication
- Zeng et al., 2023 - Loss of threonyl-tRNA synthetase-like protein Tarsl2 has little impact on protein synthesis but affects mouse development
- All Figures
- Figures for Zeng et al., 2023
|
Figure 1
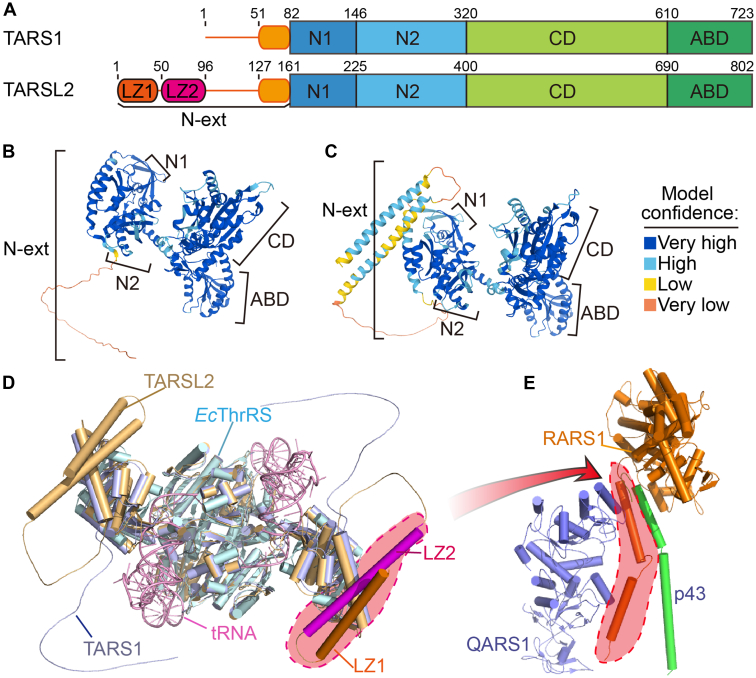
The topology of TARSL2 in the N-terminal extension differs from that of TARS1.A, the domains of TARS1 and TARSL2. B, the TARS1 structure model was predicted by AlphaFold 2. C, the TARSL2 structure model was predicted by AlphaFold 2. In (B and C), the structures are colored on the basis of the confidence of each model prediction. D, the structural models of TARS1 and TARS2 are superimposed onto the E. coli ThrRS-tRNA structure (PDB ID 1QF6). TARS1 is light blue. TARSL2 is wheat; however, the leucine zippers in one chain are highlighted in orange and magenta. E. coli ThrRS is cyan, and tRNA is pink. E, the leucine zippers of RARS1 are highlighted with a red dashed line in the RARS1–QARS1–p43 complex structure (PDB ID 4R3Z). ABD, anticodon binding domain; CD, catalytic domain; LZ, leucine zipper; N-ext, N-terminal extension; ThrRS, threonyl-tRNA synthetase.