
Figure 2
- ID
- ZDB-IMAGE-230526-63
- Publication
- Zeng et al., 2023 - Loss of threonyl-tRNA synthetase-like protein Tarsl2 has little impact on protein synthesis but affects mouse development
- All Figures
- Figures for Zeng et al., 2023
|
Figure 2
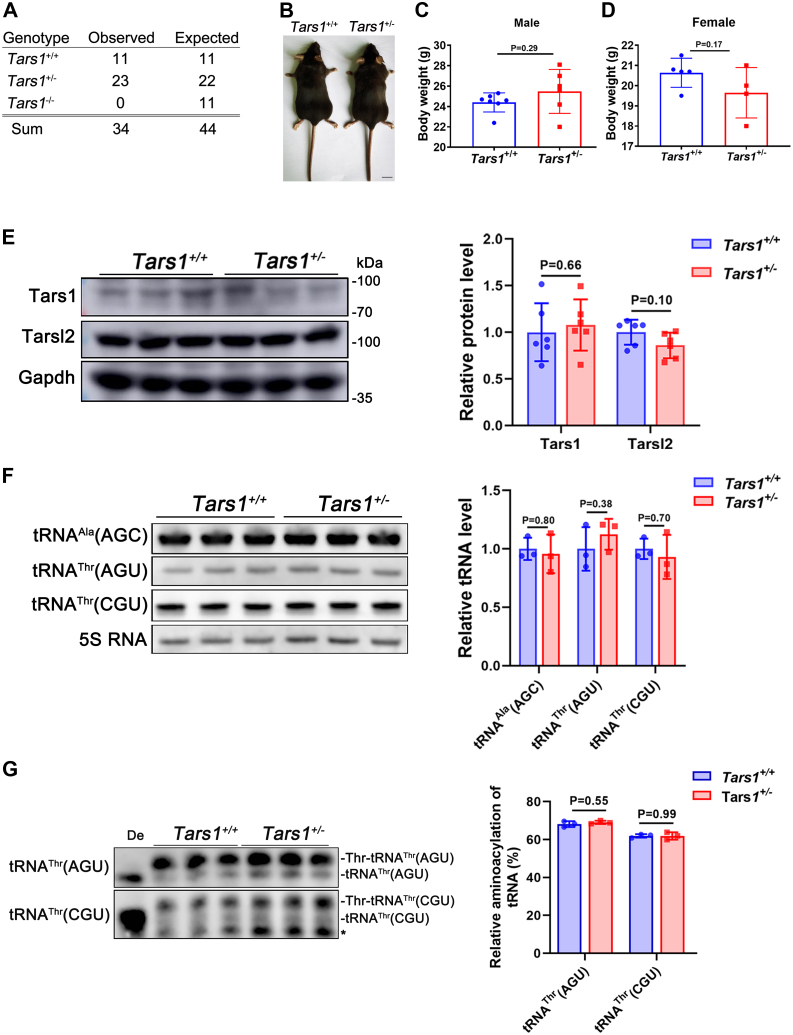
Tars1 is indispensable in vivo.A, statistical analysis showing the genetic features of the Tars1-KO mice (n = 34). B, body features of the 10-week-old Tars1+/+ and Tars1+/− mice. The scale bar represents 1 cm. C, statistical analysis showing the weights of the 16-week-old Tars1+/+ (n = 7) and Tars1+/− (n = 6) male mice. D, statistical analysis showing the weights of the 16-week-old Tars1+/+ (n = 5) and Tars1+/− (n = 4) female mice. E, protein abundance of the 8-week-old Tars1 and Tarsl2 in Tars1+/+ and Tars1+/− mouse muscle as detected by Western blot. Gapdh was used as the loading control. F, levels of tRNAAla(AGC), tRNAThr(AGU), and tRNAThr(CGU) in muscle tissues of the 8-week-old Tars1+/+ and Tars1+/− mice. 5S RNA was as the loading control. G, aminoacylation levels of tRNAThr(AGU) and tRNAThr(CGU) in muscle tissues of the 8-week-old Tars1+/+ and Tars1+/− mice. ∗, a nonspecific band. De: tRNA deaminoacylation control. Error bars in (C–G) represent the mean ± SD with the p values indicated (two-tailed Student’s t test).