
- Title
-
Sensory deficit screen identifies nsf mutation that differentially affects SNARE recycling and quality control
- Authors
- Gao, Y., Khan, Y.A., Mo, W., White, K.I., Perkins, M., Pfuetzner, R.A., Trapani, J.G., Brunger, A.T., Nicolson, T.
- Source
- Full text @ Cell Rep.
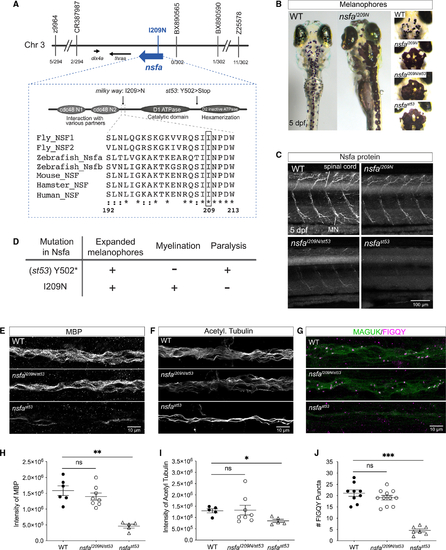
Identification of (A) Map of the critical region. A missense mutation was identified in (B)Expanded melanophore phenotype. (C)Nsfa immunolabeling in spinal cord and motor neurons in WT, (D)Summary of phenotypes in the null and I209N (E–J) Myelination and the number of nodes of Ranvier in the lateral-line nerve of mutant |
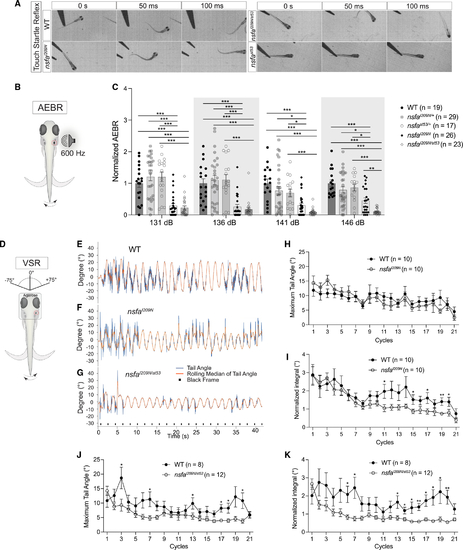
The I209N mutation in Nsfa selectively affects hearing and vestibular function without causing paralysis (A) Still frames from high-speed videos of larvae. (B) (B and C) Acoustic evoked behavioral responses of larvae exposed to a 600-Hz stimulus at the intensities indicated normalized to homozygous WT siblings. n indicates number of fish tested. (D–K) Vestibulospinal reflexes are reduced in Mean ± SEM and two-way ANOVA with Benjamini-Hochberg correction for each dataset were performed. *p < 0.05, **p < 0.01, ***p < 0.001. PHENOTYPE:
|
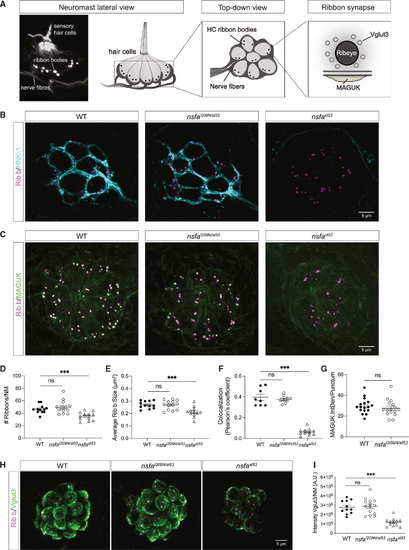
The gross morphology of ribbon synapses is normal in (A) Image and diagrams of neuromasts depicting the hair cells, afferent neurons, and ribbon synapses. (B) Representative images of afferent innervation (HNK-1) of hair cells in WT, (C) Ribbon synapses in WT, (D) Number of ribbons per neuromast (n ≥ 12 neuromasts per genotype). (E) Average size of each ribbon (n ≥ 12 neuromasts per genotype). (F) Colocalization of Ribeye b and MAGUK (n ≥ 8 neuromasts per genotype). (G) Integrated density of MAGUK immunolabel per punctum (n ≥ 12 neuromasts per genotype). (H) Images of the synaptic vesicle marker VGlut3 in WT, (I) Quantification of the intensity of the VGlut3 immunolabel (n ≥ 11 neuromasts per genotype). Quantification data are shown as mean ± SEM; p values are determined by ANOVA tests to compare with WT group. ns, not significant; *p < 0.05, **p < 0.01, ***p < 0.001. For all experiments, n ≥ 6 fish per genotype (5 dpf). All images and data are representative of 2 or 3 independent experiments. Scale bars, 5 μm. |
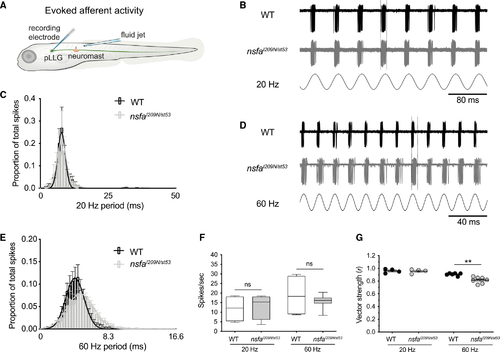
Decreased phase locking to mechanical stimuli at hair-cell ribbon synapses in (B) Representative traces from WT (upper) and (C) Average spike latency histograms from all spikes during 60 continuous seconds of 20-Hz stimulation. WT latency values (black bars) and (D and E) The timing of evoked spikes is less tightly coupled to a higher-frequency stimulus in the (F) Spike rate comparison between WT and (G) Vector strength (r) of the coupling between stimulus and response (phase locking) between WT and PHENOTYPE:
|
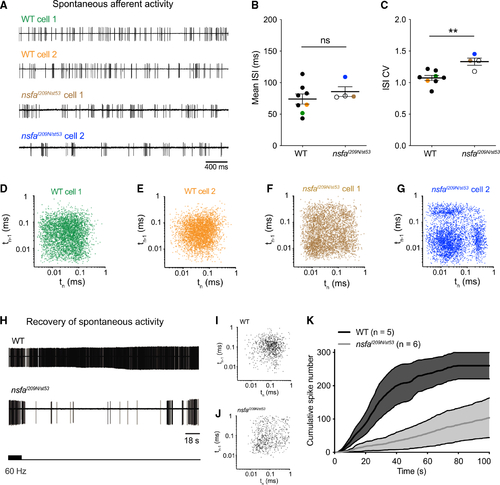
Aberrant timing and decreased recovery of spontaneous activity at hair-cell ribbon synapses in (A) Representative traces of spontaneous afferent activity in WT (green and orange traces) and (B and C) Mean ISI (B) and ISI CV (C) for spontaneous activity for WT (n = 8 cells) and (D–G) Recurrence plots reveal regularity of the timing of consecutive spikes (spike time n plotted versus spike time n – 1) for the four cells shown in (A). Note the greater spread and clustering in three quadrants for the mutant panels, indicating a more irregular, bursting pattern in mutant neurons. (H–K) Recovery of spontaneous activity is delayed in (K) Recovery of spontaneous spike rate as shown by cumulative spike number over time following cessation of 90 s of 60-Hz stimulation. Shading represents error. n indicates cell number. PHENOTYPE:
|
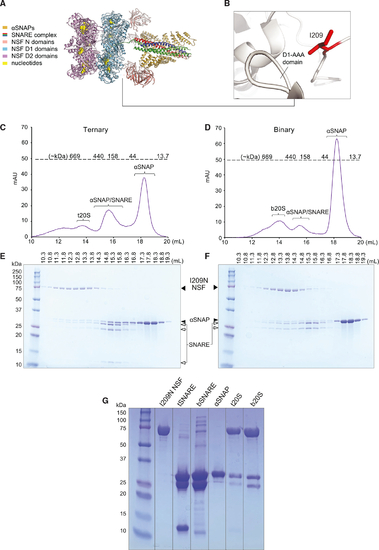
I209N NSF-αSNAP form complexes with either ternary or binary neuronal SNARE complexes (A) Cryo-EM structure of NSF 20S complex (PDB: 6MDM). (B) N-D1 linker region. I209 is shown as a red stick model. (C) Size-exclusion chromatography (SEC) profile of t20S consisting of I209N NSF, ternary (syntaxin-1A-SNAP-25-synaptobrevin-2) SNARE complex (tSNARE), and αSNAP mixed in 1:5:25 M ratios. Predicted molecular weights for the SEC are indicated above the dotted line. (D) SEC of b20S consisting of I209N NSF, binary (syntaxin-1A-SNAP-25) SNARE complex (bSNARE), and αSNAP mixed in 1:5:25 M ratios. (E) SDS-PAGE gel of fractions from SEC of t20S. The elution volumes are indicated above the gel. (F) SDS-PAGE of protein ladder and gel fractions from SEC of b20S. (G) SDS-PAGE gel of protein ladder, NSF stock, tSNARE, bSNARE, αSNAP, t20S filtered through a 100k MWCO concentrator, and b20S filtered through a 100k MWCO concentrator. SEC peaks are typical of a 20S complex preparation with WT NSF. |
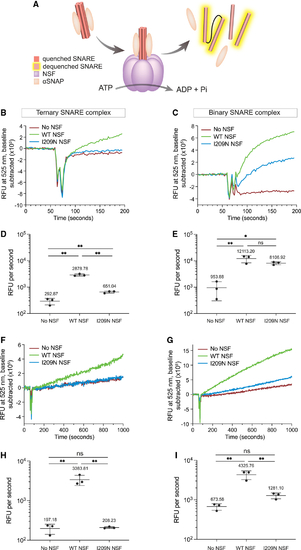
Kinetic traces of I209N NSF show diminished ability to disassemble ternary SNARE complex but retention of binary SNARE complex disassembly activity (A) Schematic of NSF-mediated disassembly. NSF (purple), αSNAP (beige), and SNARE helices are depicted. (B) NSF-mediated disassembly of ternary complex. [NSF] = 42.2 nM. (C) NSF-mediated disassembly of binary complex. [NSF] = 42.2 nM. (D) Initial rate of NSF-mediated disassembly of ternary complex with NSF. [NSF] = 42.2 nM. (E) Initial rate of NSF-mediated disassembly of binary complex with NSF. [NSF] = 42.2 nM. (F) NSF-mediated disassembly of ternary complex. [NSF] = 8.3 nM. (G) NSF-mediated disassembly of binary complex. [NSF] = 8.3 nM. (H) Initial rate of NSF-mediated disassembly of ternary complex with NSF. [NSF] = 8.3 nM. (I) Initial rate of NSF-mediated disassembly of binary complex with NSF. [NSF] = 8.3 nM. All experiments are n = 3. Error bars in (B), (C), (F), and (G) are SEM of the three independent experiments. Error bars in (D), (E), (H), and (I) are SE from Python package SciPy linear regression. p values in (D), (E), (H), and (I) are derived from one-way ANOVA. ns, not significant; *p < 0.05, **p < 0.01. |