
Figure 3.
- ID
- ZDB-IMAGE-231002-63
- Antibodies
- Publication
- Gao et al., 2023 - Sensory deficit screen identifies nsf mutation that differentially affects SNARE recycling and quality control
- All Figures
- Figures for Gao et al., 2023
|
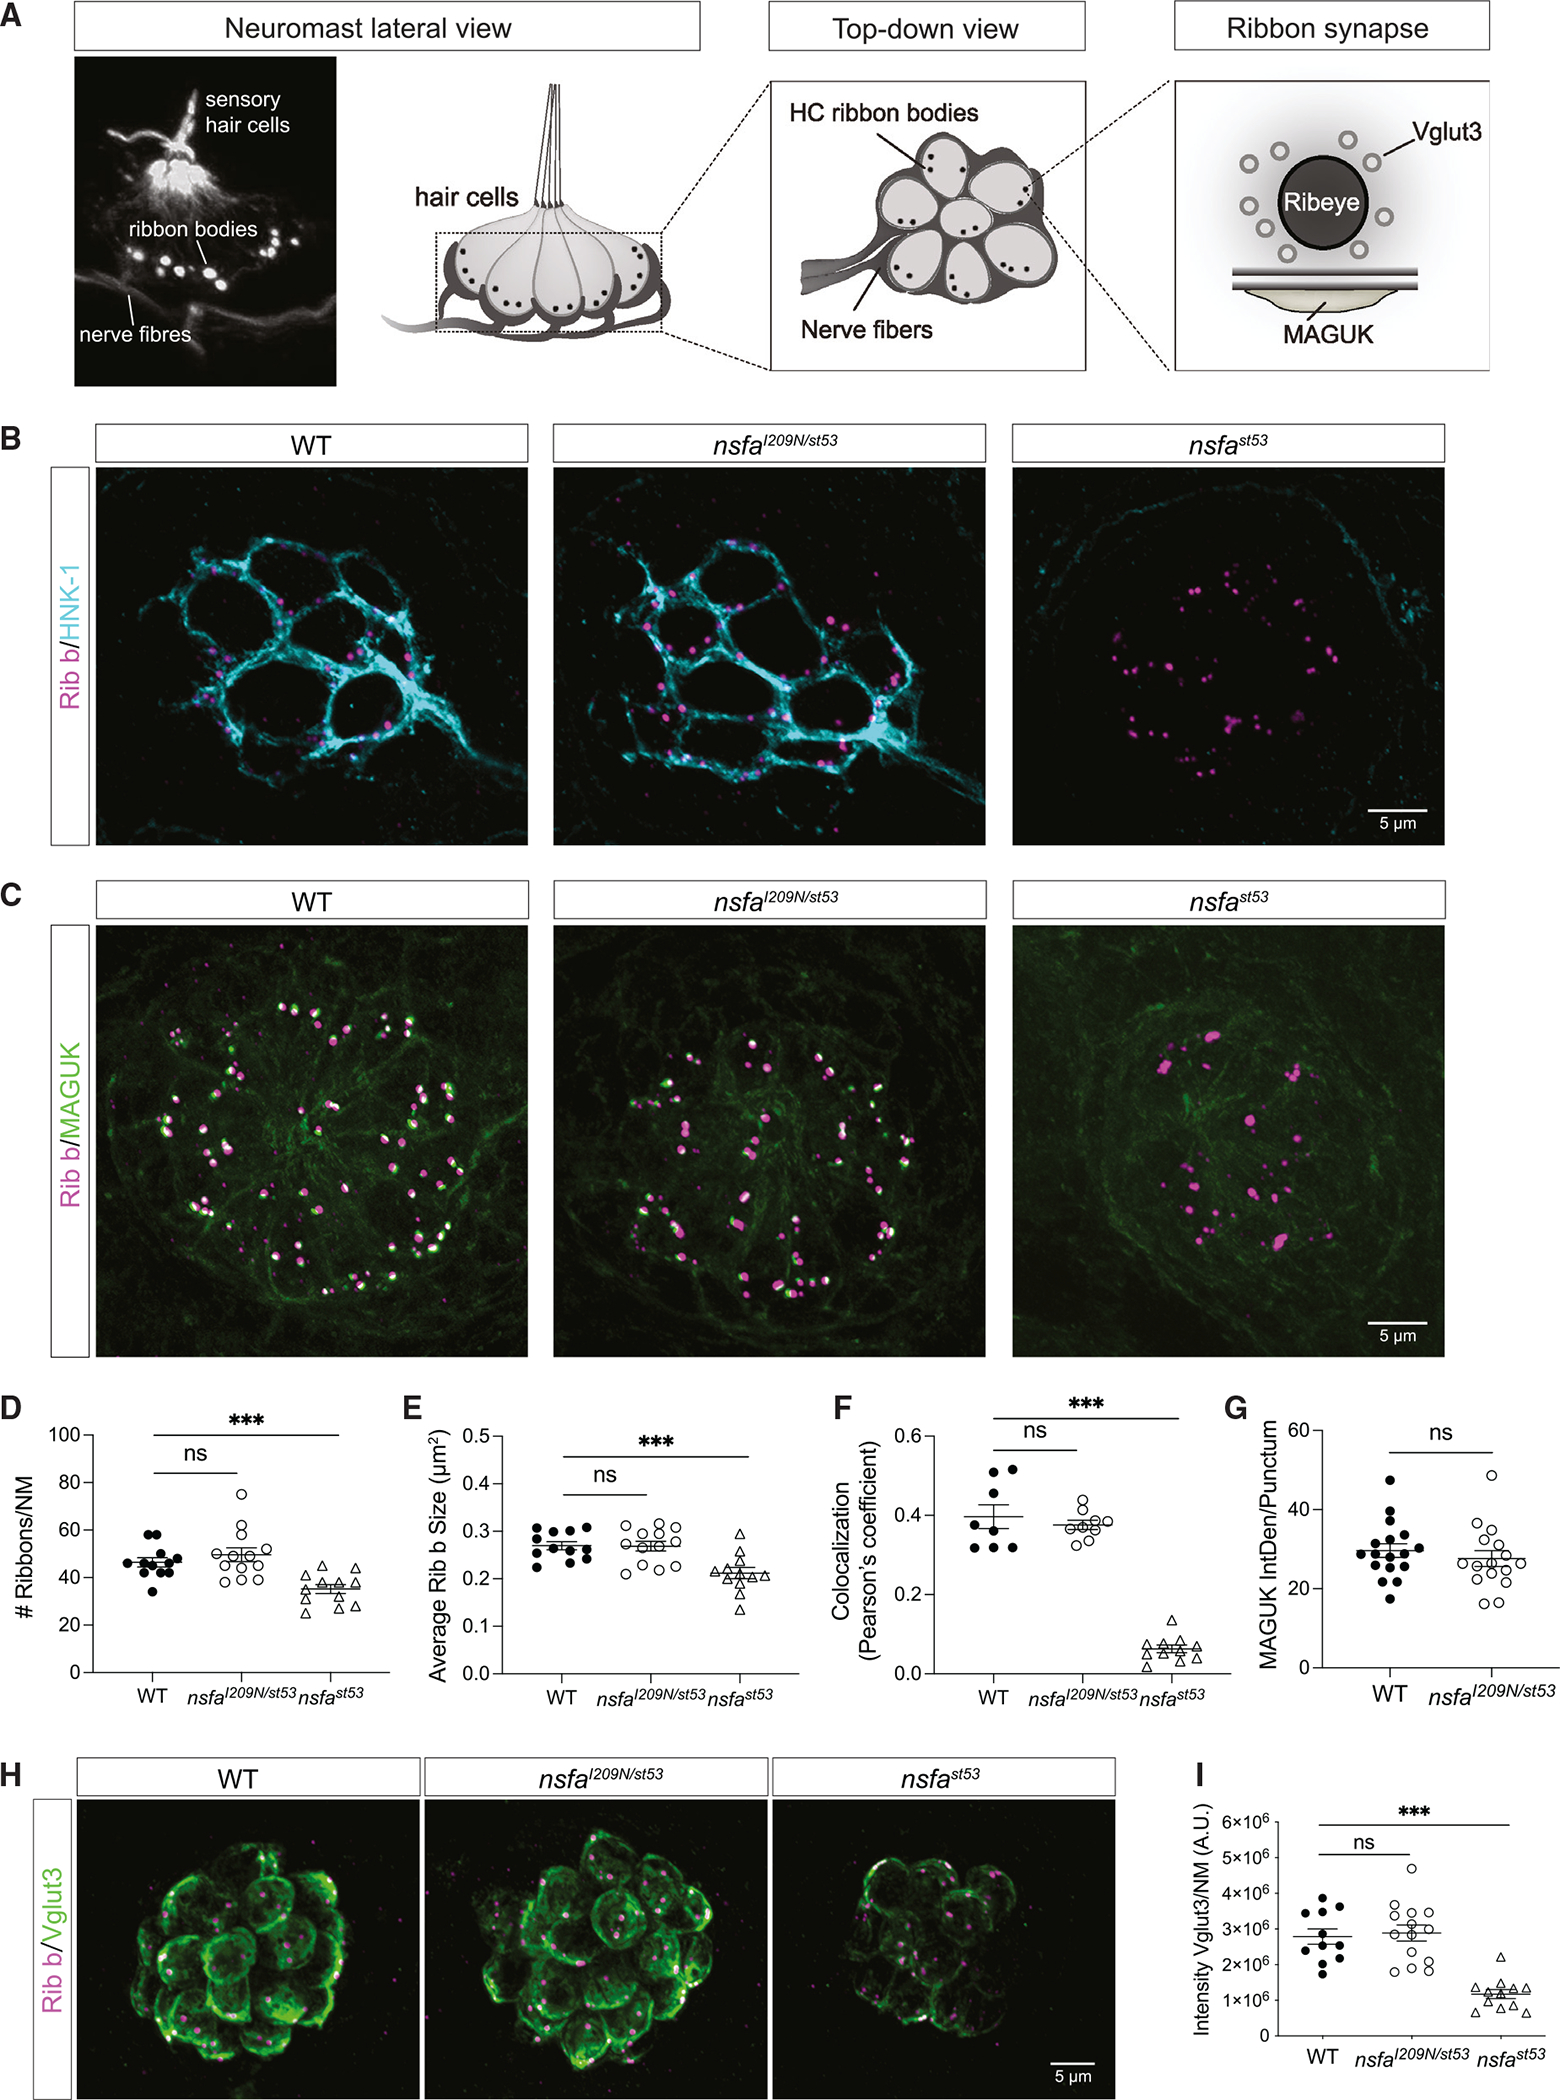
Figure 3.
The gross morphology of ribbon synapses is normal in
(A) Image and diagrams of neuromasts depicting the hair cells, afferent neurons, and ribbon synapses.
(B) Representative images of afferent innervation (HNK-1) of hair cells in WT,
(C) Ribbon synapses in WT,
(D) Number of ribbons per neuromast (n ≥ 12 neuromasts per genotype).
(E) Average size of each ribbon (n ≥ 12 neuromasts per genotype).
(F) Colocalization of Ribeye b and MAGUK (n ≥ 8 neuromasts per genotype).
(G) Integrated density of MAGUK immunolabel per punctum (n ≥ 12 neuromasts per genotype).
(H) Images of the synaptic vesicle marker VGlut3 in WT,
(I) Quantification of the intensity of the VGlut3 immunolabel (n ≥ 11 neuromasts per genotype).
Quantification data are shown as mean ± SEM; p values are determined by ANOVA tests to compare with WT group. ns, not significant; *p < 0.05, **p < 0.01, ***p < 0.001. For all experiments, n ≥ 6 fish per genotype (5 dpf). All images and data are representative of 2 or 3 independent experiments. Scale bars, 5 μm.