Figure Caption
Figure 4.
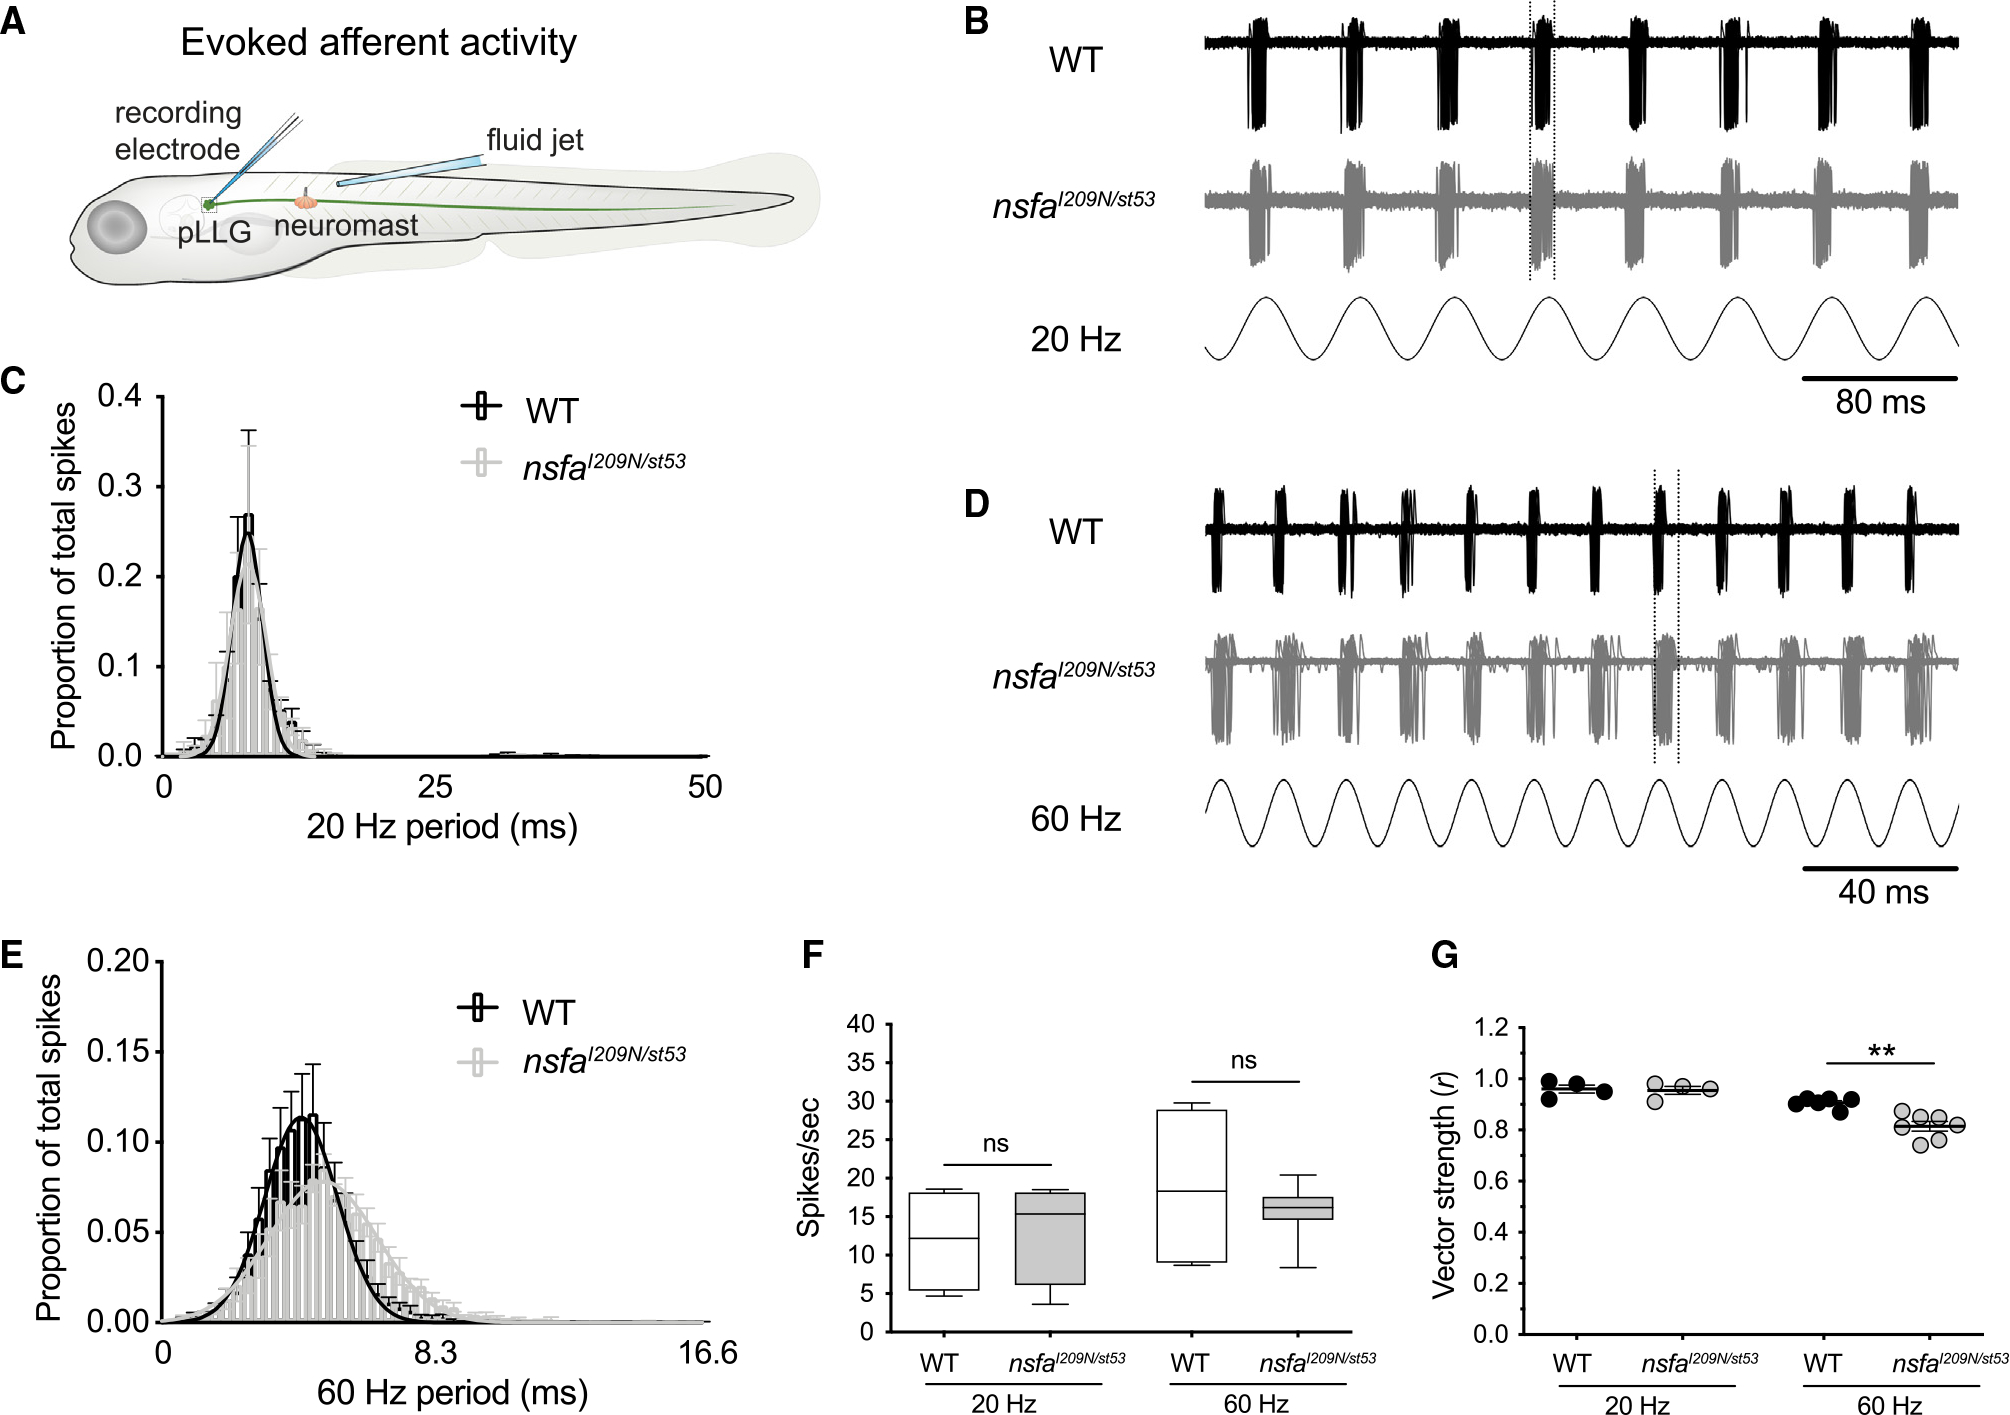
Decreased phase locking to mechanical stimuli at hair-cell ribbon synapses in nsfaI209N/st53 mutants at 60 Hz (A) Schematic of the recording paradigm. Hair cells were mechanically stimulated after establishing a loose-patch recording from the innervating afferent neuron (5 dpf). (B and C) Evoked spike rates and phase locking during a lower-frequency stimulus.
(B) Representative traces from WT (upper) and nsfaI209N/st53 mutants (middle) during 20-Hz stimulation (bottom). Shown are 60 overlaid sweeps of spiking resulting in 546 spikes in WT and 559 spikes in nsfaI209N/st53 mutants.
(C) Average spike latency histograms from all spikes during 60 continuous seconds of 20-Hz stimulation. WT latency values (black bars) and nsfaI209N/st53 mutant values (gray bars) were fit by a Gaussian distribution (black and gray line, mean fraction of 20-Hz period 0.158 ± 0.002 and 0.159 ± 0.003 s, respectively).
(D and E) The timing of evoked spikes is less tightly coupled to a higher-frequency stimulus in the nsfaI209N/st53 mutant. (D) Representative traces from WT (upper) and nsfaI209N/st53 mutants (middle) during 60-Hz stimulation (bottom). Shown are 60 overlaid sweeps of spiking resulting in 219 spikes in WT and 217 spikes in nsfaI209N/st53 mutants. (E) Average latency histograms from all spikes during 60 continuous seconds of 60-Hz stimulation. WT latency values (black bars) and nsfaI209N/st53 values (gray bars) were fit by a Gaussian distribution (black and gray line, mean fraction of 60-Hz period 0.258 ± 0.003 and 0.298 ± 0.003 s, respectively). The peak of activity in mutant neurons is shifted to a later time point of the 60-Hz cycle (4.28 versus 4.95 ms) in comparison.
(F) Spike rate comparison between WT and nsfaI209N/st53 mutants at both 20 Hz (WT, 12 ± 3 spikes/s, n = 4; nsfaI209N/st53, 13 ± 3 spikes/s, n = 4, p = 0.80) and 60 Hz (WT, 19 ± 3 spikes/s, n = 7; nsfaI209N/st53, 16 ± 1 spikes/s, n = 7, p = 0.32). Center lines represent the mean.
(G) Vector strength (r) of the coupling between stimulus and response (phase locking) between WT and nsfaI209N/st53 mutants at 20 Hz (WT, r = 0.96 ± 0.02, n = 4;
nsfaI209N/st53 mutants, r = 0.96 ± 0.02, n = 4) and 60 Hz (from C: WT, r = 0.91 ± 0.01, n = 6; nsfaI209N/st53 mutants, r = 0.81 ± 0.02, n = 7, p = 0.001). p values are determined by unpaired Student’s two-tailed t test. ns, not significant; *p < 0.05, **p < 0.01, ***p < 0.001.
Acknowledgments
This image is the copyrighted work of the attributed author or publisher, and
ZFIN has permission only to display this image to its users.
Additional permissions should be obtained from the applicable author or publisher of the image.
Full text @ Cell Rep.