IMAGE

Figure 1.

ID
ZDB-IMAGE-231002-61
Source
Figures for Gao et al., 2023
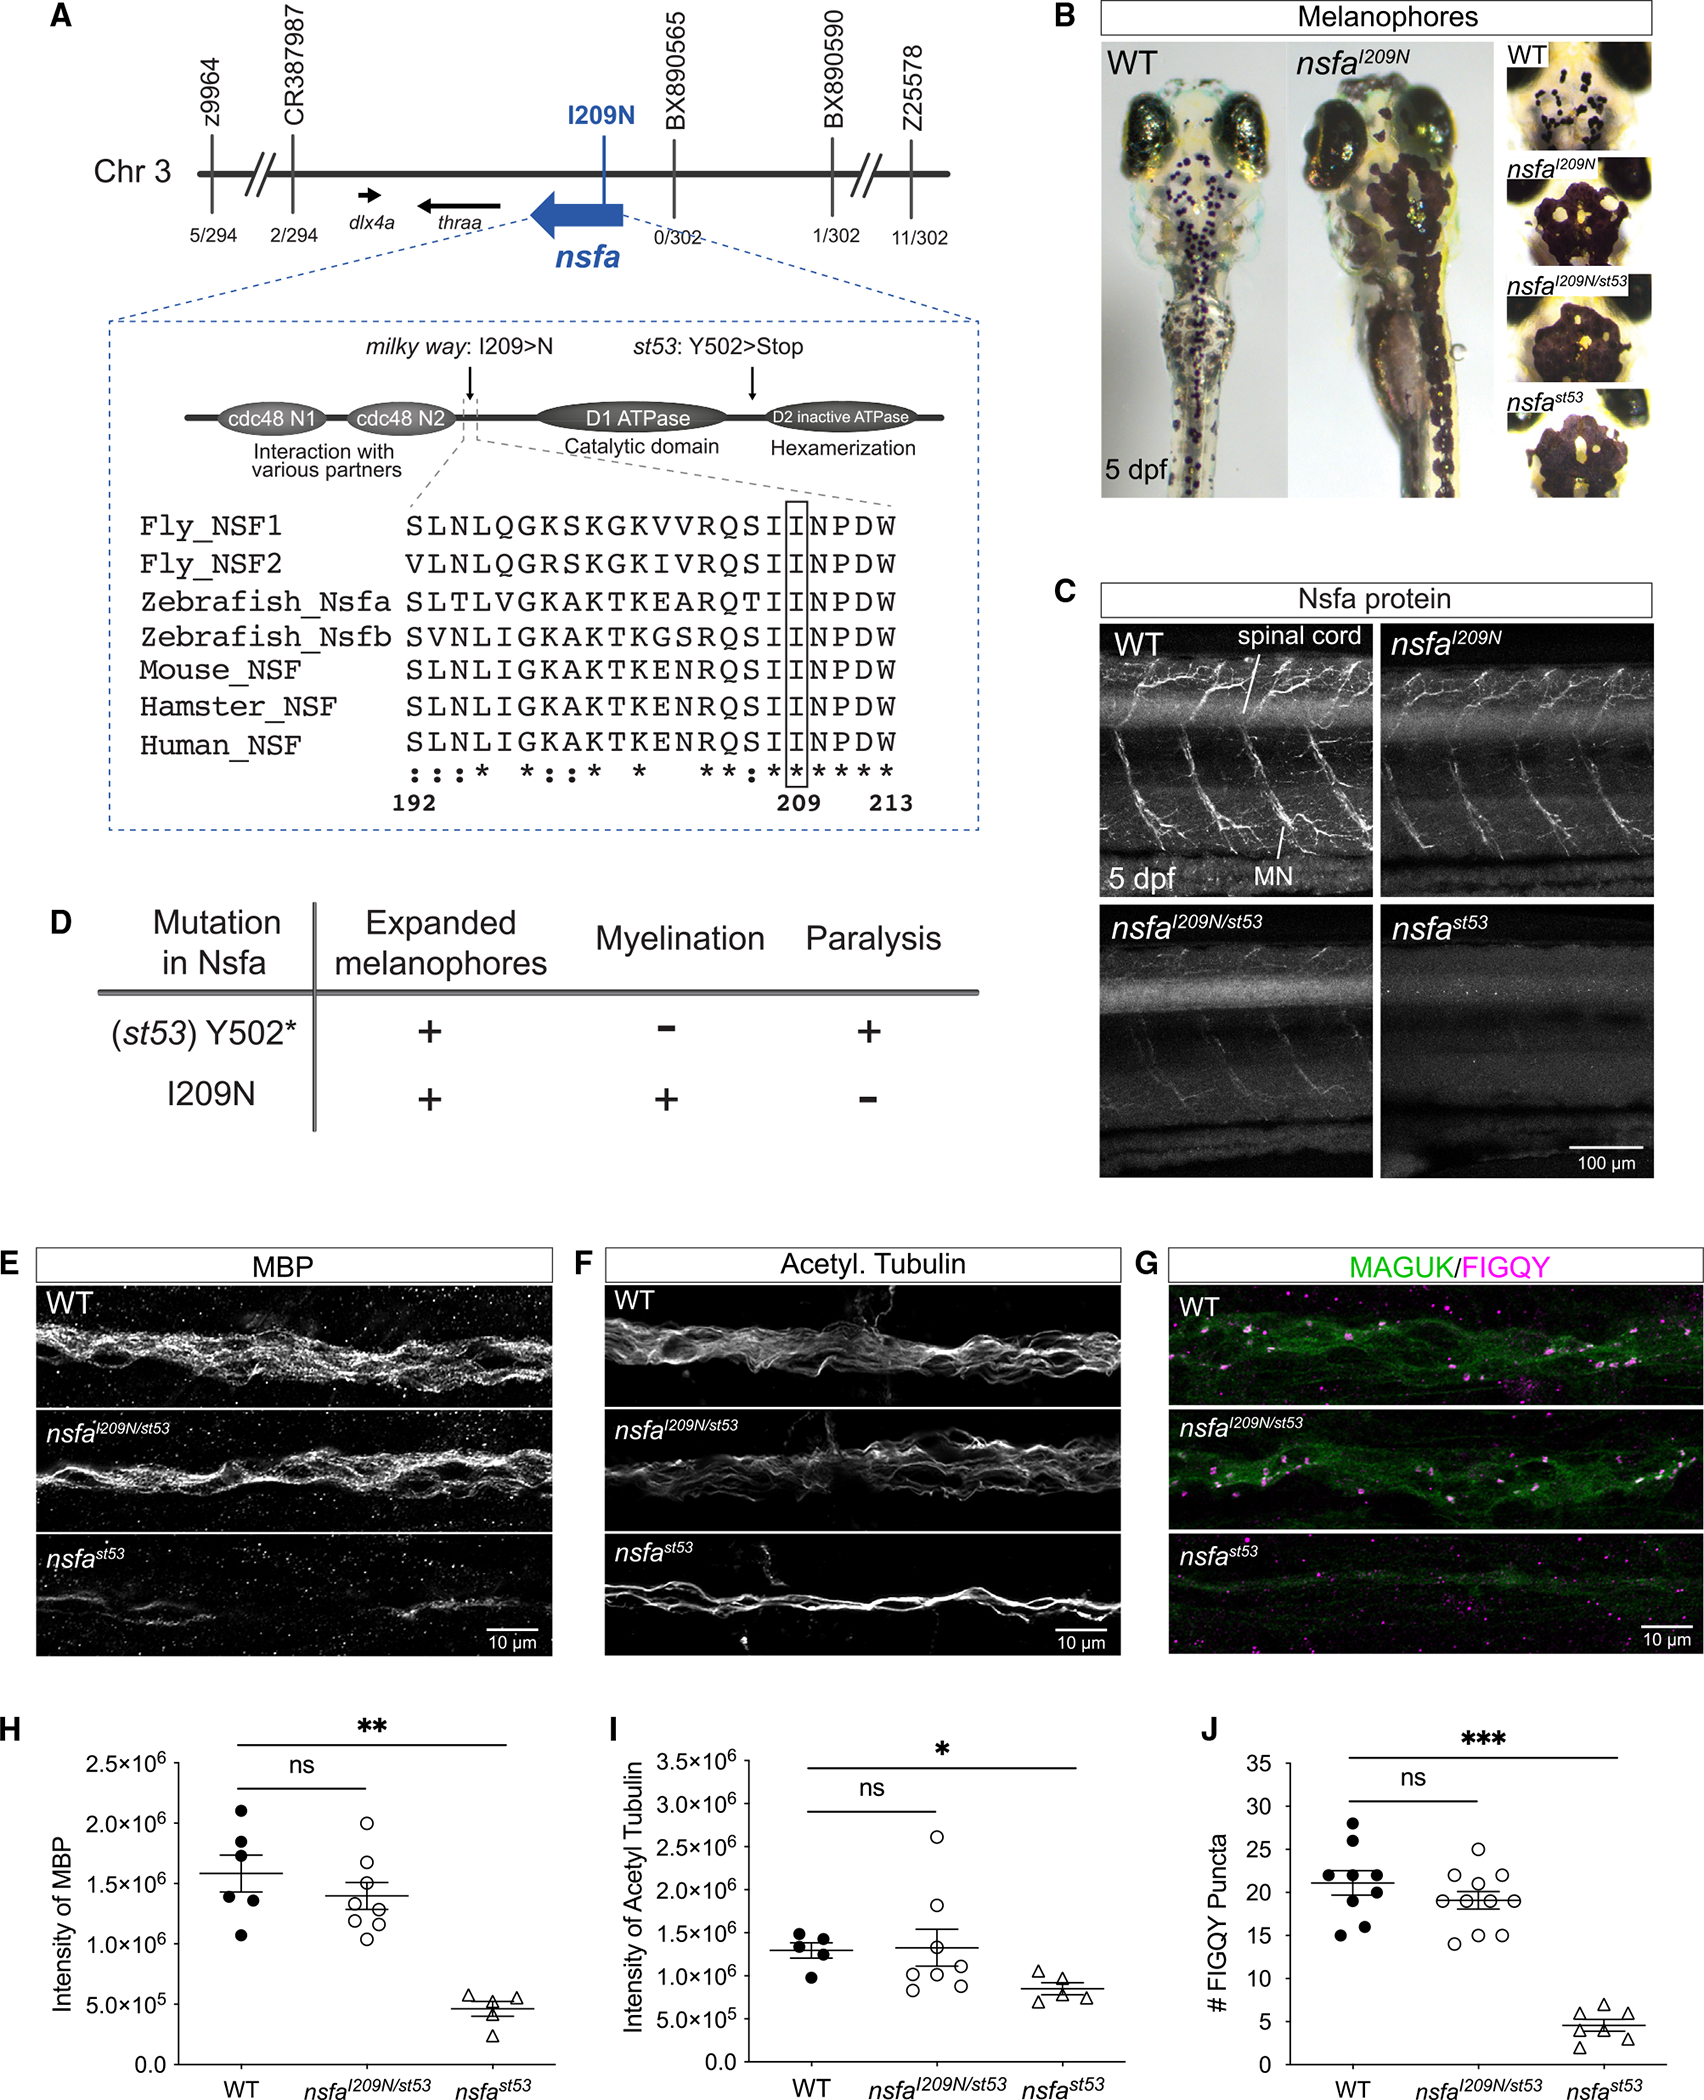
Image
Figure Caption

Figure 1. Identification of milky way as a hypomorphic allele of nsfa

(A) Map of the critical region. A missense mutation was identified in nsfa. The null allele of nsfa (st53) is also indicated. Protein sequence of the linker region of NSF near I209 (boxed) from various species.

(B)Expanded melanophore phenotype.

(C)Nsfa immunolabeling in spinal cord and motor neurons in WT, nsfaI209N homozygous mutants, dnsfaI209N/st53 compound heterozygotes, and nsfast53 homozygous mutants. Scale bar, 100 μm.

(D)Summary of phenotypes in the null and I209N nsfa mutants.

(E–J) Myelination and the number of nodes of Ranvier in the lateral-line nerve of mutant nsfaI209N/st53 larvae are comparable with that seen in WT siblings. Representative images (E–G) and quantification (H–J) of MBP, AcTub, and FIGQY antibody labeling (with colabeling of the postsynaptic density by MAGUK) in WT, nsfaI209N/st53, and nsfast53 larvae. Images are maximum intensity z projections from the initial segment of the posterior lateral-line nerve. Quantification data are shown as mean ± SEM; p values were determined by Student’s t tests to compare with WT group. ns, not significant; *p < 0.05, **p < 0.01, ***p < 0.001. For all experiments, n ≥ 5 fish per genotype (5 dpf). All images and data are representative of 2 or 3 independent experiments. Scale bar, 10 μm.

Acknowledgments
This image is the copyrighted work of the attributed author or publisher, and ZFIN has permission only to display this image to its users. Additional permissions should be obtained from the applicable author or publisher of the image. Full text @ Cell Rep.