
Figure 5.
- ID
- ZDB-FIG-231002-66
- Publication
- Gao et al., 2023 - Sensory deficit screen identifies nsf mutation that differentially affects SNARE recycling and quality control
- Other Figures
- All Figure Page
- Back to All Figure Page
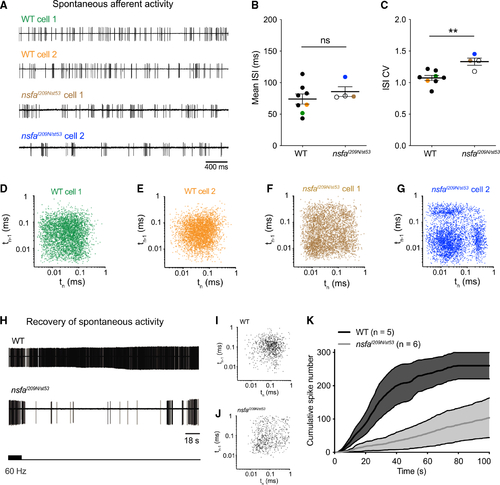
Aberrant timing and decreased recovery of spontaneous activity at hair-cell ribbon synapses in (A) Representative traces of spontaneous afferent activity in WT (green and orange traces) and (B and C) Mean ISI (B) and ISI CV (C) for spontaneous activity for WT (n = 8 cells) and (D–G) Recurrence plots reveal regularity of the timing of consecutive spikes (spike time n plotted versus spike time n – 1) for the four cells shown in (A). Note the greater spread and clustering in three quadrants for the mutant panels, indicating a more irregular, bursting pattern in mutant neurons. (H–K) Recovery of spontaneous activity is delayed in (K) Recovery of spontaneous spike rate as shown by cumulative spike number over time following cessation of 90 s of 60-Hz stimulation. Shading represents error. n indicates cell number. |
| Fish: | |
|---|---|
| Condition: | |
| Observed In: | |
| Stage: | Day 5 |