
Figure 7.
- ID
- ZDB-FIG-231002-68
- Publication
- Gao et al., 2023 - Sensory deficit screen identifies nsf mutation that differentially affects SNARE recycling and quality control
- Other Figures
- All Figure Page
- Back to All Figure Page
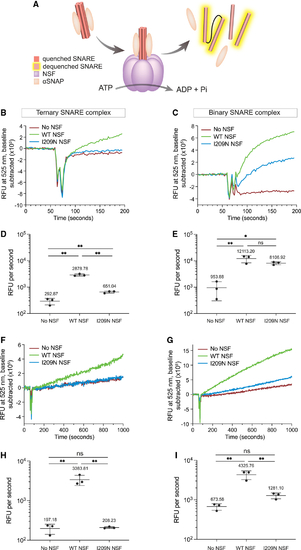
Kinetic traces of I209N NSF show diminished ability to disassemble ternary SNARE complex but retention of binary SNARE complex disassembly activity (A) Schematic of NSF-mediated disassembly. NSF (purple), αSNAP (beige), and SNARE helices are depicted. (B) NSF-mediated disassembly of ternary complex. [NSF] = 42.2 nM. (C) NSF-mediated disassembly of binary complex. [NSF] = 42.2 nM. (D) Initial rate of NSF-mediated disassembly of ternary complex with NSF. [NSF] = 42.2 nM. (E) Initial rate of NSF-mediated disassembly of binary complex with NSF. [NSF] = 42.2 nM. (F) NSF-mediated disassembly of ternary complex. [NSF] = 8.3 nM. (G) NSF-mediated disassembly of binary complex. [NSF] = 8.3 nM. (H) Initial rate of NSF-mediated disassembly of ternary complex with NSF. [NSF] = 8.3 nM. (I) Initial rate of NSF-mediated disassembly of binary complex with NSF. [NSF] = 8.3 nM. All experiments are n = 3. Error bars in (B), (C), (F), and (G) are SEM of the three independent experiments. Error bars in (D), (E), (H), and (I) are SE from Python package SciPy linear regression. p values in (D), (E), (H), and (I) are derived from one-way ANOVA. ns, not significant; *p < 0.05, **p < 0.01. |