
- Title
-
Impact of the Voltage-Gated Calcium Channel Antagonist Nimodipine on the Development of Oligodendrocyte Precursor Cells
- Authors
- Enders, M., Weier, A., Chunder, R., An, Y., Bremm, F., Feigenspan, A., Buettner, C., Ekici, A.B., Mingardo, E., Odermatt, B., Kuerten, S.
- Source
- Full text @ Int. J. Mol. Sci.
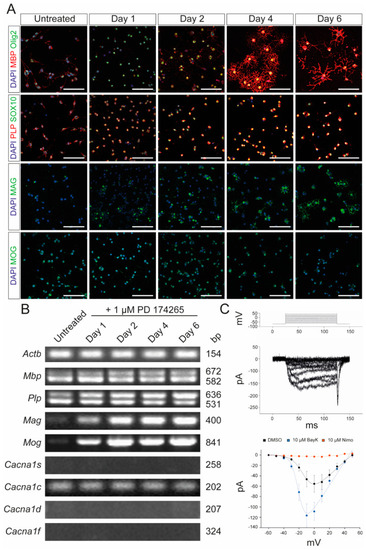
Characterization of Oli-Neu cells. (A) Immunocytochemical analysis of Oli-Neu cells with MBP (red)/Olig2 (green), PLP (red)/SOX10 (green), MAG (green), and MOG (green) after 1, 2, 4, and 6 days, respectively, following stimulation with 1 µM PD 174265 compared to untreated cells. Scale bars represent 100 µm. (B) End-point PCR showed increased expression of Mag and Mog after stimulation with 1 µM PD174265. Values on the right indicate the length of the PCR product in base pairs (bp). (C) Patch-clamp experiments showed the physiological presence of voltage-gated calcium channels that could be blocked by 10 µM nimodipine and activated by 10 µM BayK8644. DMSO was used as a control. The graph displays the data points of measured electric currents (Y-axis) against the applied voltages (X-axis). Error bars indicate standard deviations. Values are representative of n = 3 independent experiments and are presented as mean ± standard deviation. Actb: beta-actin; BayK: BayK8644; bp: base pairs; Cacna1s: voltage-gated L-type calcium channel 1.1; Cacna1c: voltage-gated L-type calcium channel 1.2; Cacna1d: voltage-gated L-type calcium channel 1.3; Cacna1f: voltage-gated L-type calcium channel 1.4; DAPI: 4′,6-diamidino-2-phenylindole; DMSO: dimethyl sulfoxide; MAG: myelin-associated glycoprotein; MBP: myelin basic protein; MOG: myelin oligodendrocyte glycoprotein; ms: milliseconds; mv: millivolt; pA: picoamperes; Nimo: nimodipine; Olig2: oligodendrocyte transcription factor 2; PCR: polymerase chain reaction; PLP: proteolipid protein; SOX10: SRY-box transcription factor 10. |
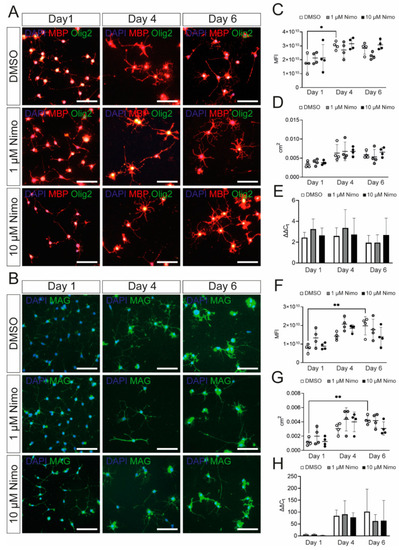
Oli-Neu cells show increased expression of myelin-related genes after PD 174265 treatment. (A,B) Staining of stimulated Oli-Neu cells treated with DMSO, 1 µM, or 10 µM nimodipine. Images show MBP (red)/Olig2 (green) (A) or MAG (B). Scale bars represent 100 µm. In n = 10 images, the MFI (C,F) and the area occupied by all cells per image in cm2 (D,G) were measured. (E,H) mRNA expression of Mbp (E) and Mag (H). Data are presented as mean value ± standard deviation. All experiments were performed as n = 4 independent experiments. Kruskal–Wallis test was performed to test for statistical significance. * p |
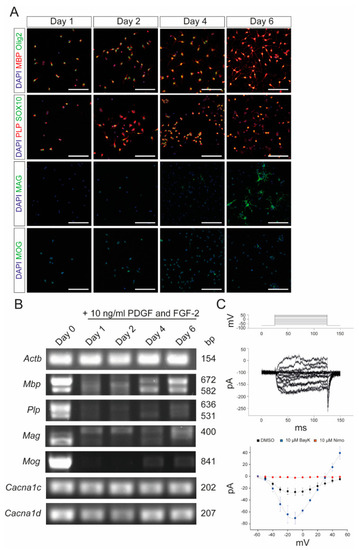
Characterization of primary OPCs after stimulation with PDGF and FGF-2. (A) Immunocytochemistry of OPCs with MBP (red)/Olig2 (green), PLP (red)/SOX10 (green), MAG (green), and MOG (green) after 1, 2, 4, and 6 days, respectively, following stimulation with 10 ng/mL PDGF and FGF-2. Scale bars represent 100 µm. (B) End-point PCR after stimulation with 10 ng/mL PDGF and FGF-2. Values on the right indicate the length of the PCR products in base pairs. (C) Patch-clamp experiments revealed the physiological presence of VGCCs, which could be blocked by 10 µM nimodipine and activated by 10 µM BayK8644. DMSO was used as control agent. Data are presented as mean ± standard deviation. All experiments were performed as n = 3 independent experiments. Actb: beta-actin; BayK: BayK8644; bp: base pairs; Cacna1c: voltage-gated L-type calcium channel 1.2; Cacna1d: voltage-gated L-type calcium channel 1.3; DAPI: 4′,6-diamidino-2-phenylindole; DMSO: dimethyl sulfoxide; FGF-2: fibroblast growth factor 2; Mag: myelin-associated glycoprotein; Mbp: myelin basic protein; Mog: myelin oligodendrocyte glycoprotein; ms: milliseconds; mV: millivolt; Nimo: nimodipine; pA: picoamperes; PDGF: platelet-derived growth factor; Plp: proteolipid protein; SOX10: SRY-box transcription factor 10; VGCC: voltage-gated L-type calcium channel. |
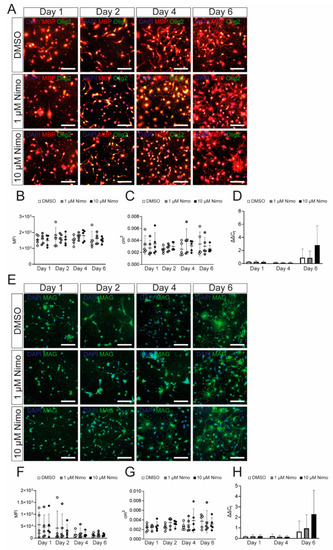
Nimodipine does not have an impact on myelin gene and protein expression by oligodendrocyte precursor cells. (A,E). Staining of oligodendrocyte precursor cells treated with DMSO, 1 µM nimodipine, or 10 µM nimodipine. Images show MBP (red)/Olig2 (green) (A) or MAG (E). DAPI indicates nuclear staining. Scale bars indicate 100 µm. The MFI (B,F) and the area occupied by all cells in each image (C,G) were measured in n = 10 images per condition. (D,H) mRNA expression of Mbp (D) and Mag (H). n = 5 independent experiments of every experiment were performed. Error bars indicate mean ± standard deviation. Kruskal–Wallis test was performed to test for statistical significance. cm2: square centimeters; DAPI: 4′,6-diamidino-2-phenylindole; DMSO: dimethyl sulfoxide; MAG: myelin-associated glycoprotein; MBP: myelin basic protein; MFI: mean fluorescent intensity; Nimo: nimodipine. |
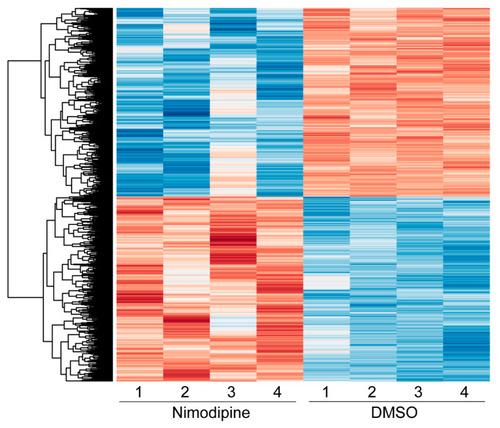
Heatmap showing the hierarchical clustering of all differentially expressed genes comparing nimodipine-treated and DMSO-treated Oli-Neu cells after 24 h. Red indicates upregulated genes, while blue indicates downregulated genes. The numbers 1, 2, 3, and 4 represent the individual experiments. Results from significance tests were corrected for multiple testing using the Benjamini–Hochberg method. DMSO: dimethyl sulfoxide. |
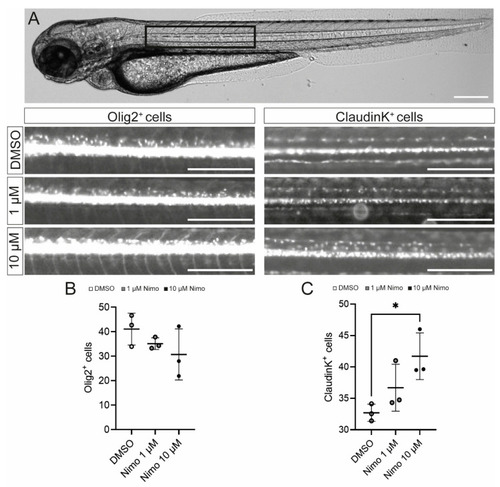
Nimodipine treatment increases the number of oligodendrocytes, but not oligodendrocyte precursor cells, in an in vivo zebrafish model. (A) Light microscopic image of a zebrafish. The black box highlights the area of interest that was used for quantitative cell analyses, as shown below. Scale bars indicate 250 µM. (B,C) Numbers of Olig2+ cells (B) and claudinK+ cells (C) in the area of interest. Ordinary one-way ANOVA was performed to test for statistical significance. * p < 0.05. A single data point represents a mean value of n = 8 zebrafish. Data are representative of n = 3 independent experiments. DMSO: dimethyl sulfoxide; Nimo: nimodipine. |