
|
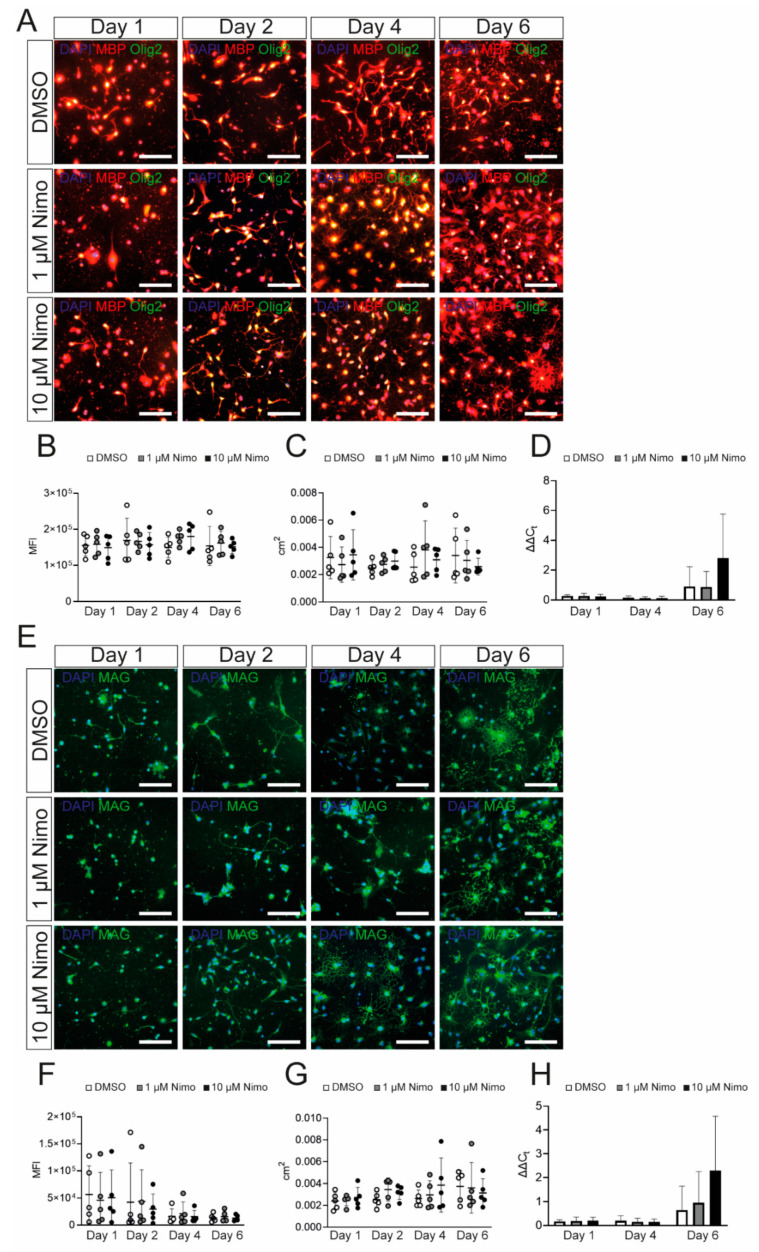
Figure 4
Nimodipine does not have an impact on myelin gene and protein expression by oligodendrocyte precursor cells. (A,E). Staining of oligodendrocyte precursor cells treated with DMSO, 1 µM nimodipine, or 10 µM nimodipine. Images show MBP (red)/Olig2 (green) (A) or MAG (E). DAPI indicates nuclear staining. Scale bars indicate 100 µm. The MFI (B,F) and the area occupied by all cells in each image (C,G) were measured in n = 10 images per condition. (D,H) mRNA expression of Mbp (D) and Mag (H). n = 5 independent experiments of every experiment were performed. Error bars indicate mean ± standard deviation. Kruskal–Wallis test was performed to test for statistical significance. cm2: square centimeters; DAPI: 4′,6-diamidino-2-phenylindole; DMSO: dimethyl sulfoxide; MAG: myelin-associated glycoprotein; MBP: myelin basic protein; MFI: mean fluorescent intensity; Nimo: nimodipine.