
|
Figure 6
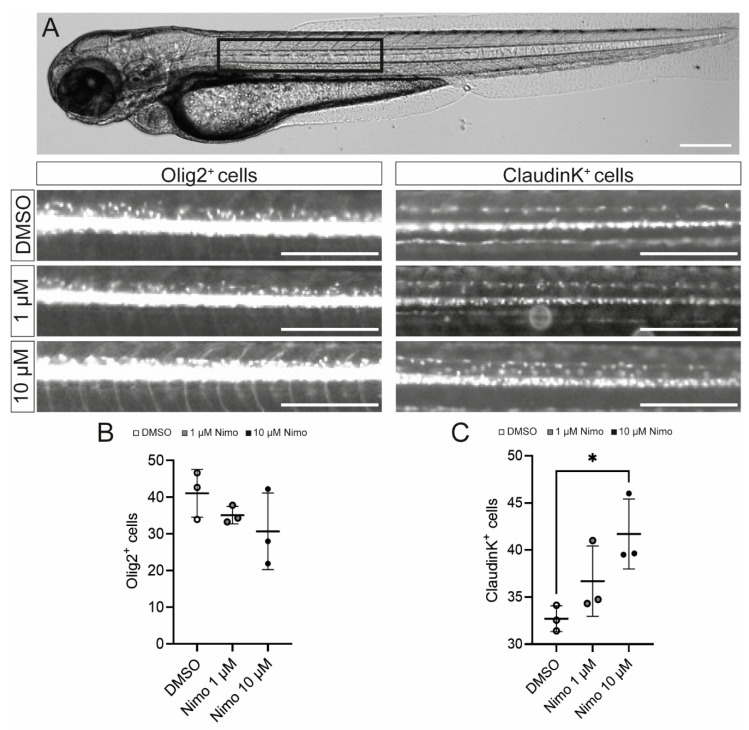
Nimodipine treatment increases the number of oligodendrocytes, but not oligodendrocyte precursor cells, in an in vivo zebrafish model. (A) Light microscopic image of a zebrafish. The black box highlights the area of interest that was used for quantitative cell analyses, as shown below. Scale bars indicate 250 µM. (B,C) Numbers of Olig2+ cells (B) and claudinK+ cells (C) in the area of interest. Ordinary one-way ANOVA was performed to test for statistical significance. * p < 0.05. A single data point represents a mean value of n = 8 zebrafish. Data are representative of n = 3 independent experiments. DMSO: dimethyl sulfoxide; Nimo: nimodipine.