
Image
|
Figure Caption
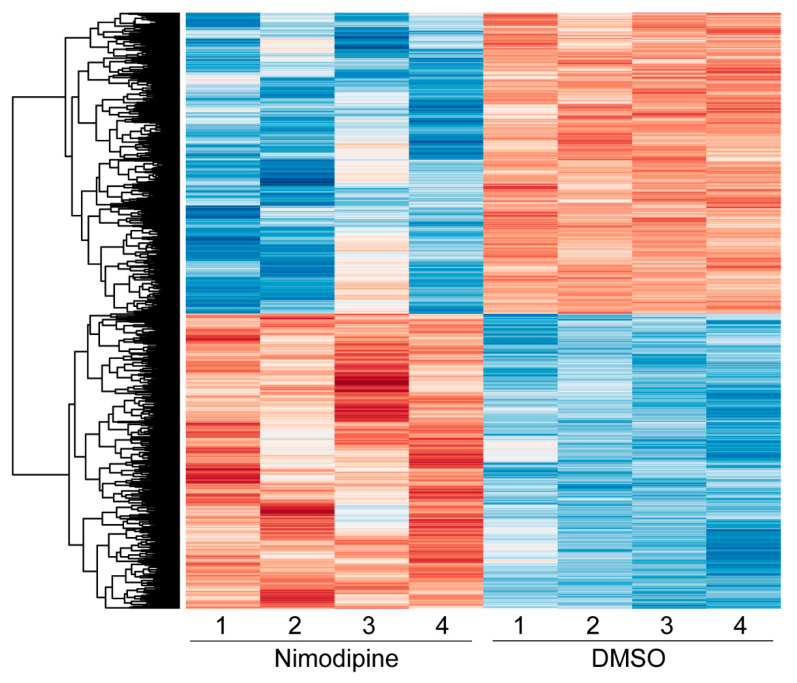
Figure 5
Heatmap showing the hierarchical clustering of all differentially expressed genes comparing nimodipine-treated and DMSO-treated Oli-Neu cells after 24 h. Red indicates upregulated genes, while blue indicates downregulated genes. The numbers 1, 2, 3, and 4 represent the individual experiments. Results from significance tests were corrected for multiple testing using the Benjamini–Hochberg method. DMSO: dimethyl sulfoxide.
Acknowledgments
This image is the copyrighted work of the attributed author or publisher, and
ZFIN has permission only to display this image to its users.
Additional permissions should be obtained from the applicable author or publisher of the image.
Full text @ Int. J. Mol. Sci.