
|
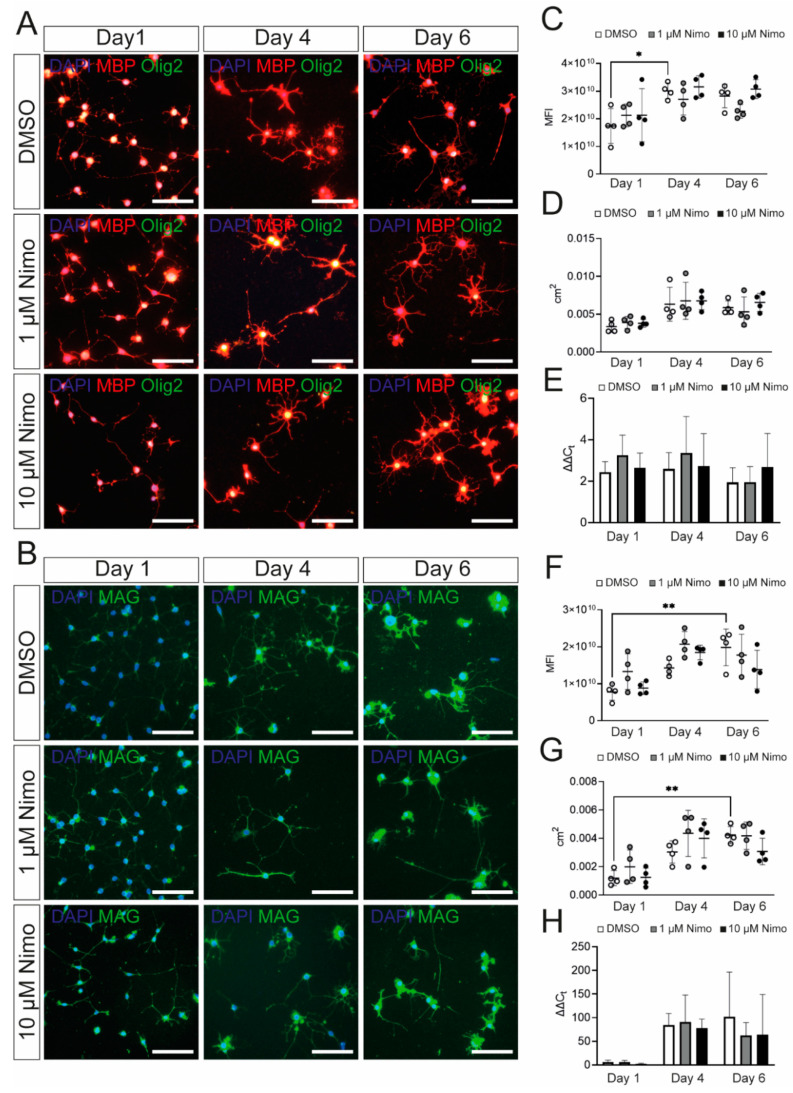
Figure 2
Oli-Neu cells show increased expression of myelin-related genes after PD 174265 treatment. (A,B) Staining of stimulated Oli-Neu cells treated with DMSO, 1 µM, or 10 µM nimodipine. Images show MBP (red)/Olig2 (green) (A) or MAG (B). Scale bars represent 100 µm. In n = 10 images, the MFI (C,F) and the area occupied by all cells per image in cm2 (D,G) were measured. (E,H) mRNA expression of Mbp (E) and Mag (H). Data are presented as mean value ± standard deviation. All experiments were performed as n = 4 independent experiments. Kruskal–Wallis test was performed to test for statistical significance. * p