
- Title
-
Effects of Nutritionally Induced Obesity on Metabolic Pathways of Zebrafish
- Authors
- Li, X., Ge, G., Song, G., Li, Q., Cui, Z.
- Source
- Full text @ Int. J. Mol. Sci.
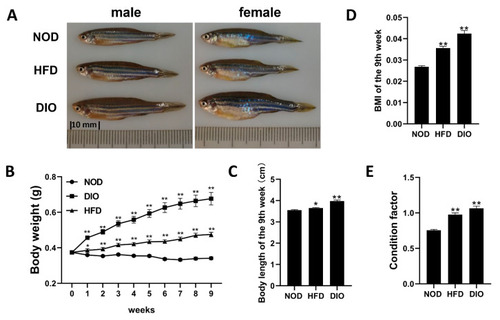
Both HFD and DIO induced obese phenotypes in zebrafish. (A) Lateral views of NOD, DIO and HFD zebrafish after 9 weeks of feeding. The distance between two dashes is 10 mm. (B) Changes in body weight during 9-week feeding experiments. (C) Changes in body length after 9 weeks of feeding. (D) Changes in BMI after 9 weeks of feeding. (E) Changes in condition factor after 9 weeks of feeding. *, p < 0.05, **, p < 0.01. Values are means ± SEM. Each group has 60 fish. |
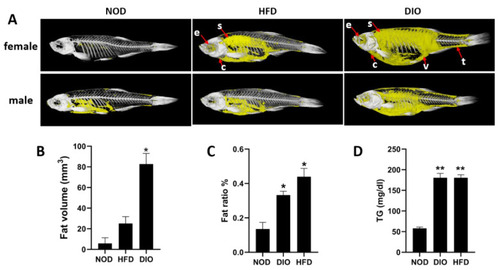
Lipid accumulation and fat distribution in three groups. (A) The in vivo micro-CT scans of zebrafish. Each group measures 4 fish, including 2 females and 2 males. Yellow: adipose tissue; white: bone; e: eyes; s: subcutaneous; c: heart; v: viscera; t: tail. (B) Quantitative analysis of the fat volume. Each group measures 4 fish, including 2 females and 2 males. Values are means ± SEM. (C) Total lipid content of whole fish. (D) Plasma TG levels. *, p < 0.05, **, p < 0.01. Values are means ± SEM. n = 4 for each group. |
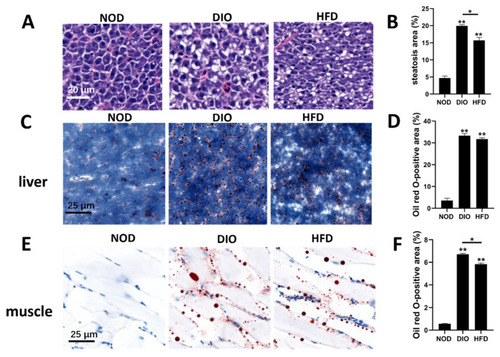
Characterization of hepatic steatosis and ectopic accumulation of lipid droplets in the liver and muscle. (A) Livers of zebrafish in NOD, DIO and HFD groups were analyzed with hematoxylin and eosin staining. (B) Quantitative analysis of the area of hepatic steatosis in zebrafish. Steatosis of three NOD, three HFD and three DIO across the liver were determined using the ImageJ software. Values are means ± SEM. **, p < 0.01. (C,E) Livers and muscles of zebrafish in NOD, DIO and HFD groups were analyzed with Oil Red O. (D,F) Quantitative analysis of the area of lipid droplets in liver and muscle. The areas of lipid droplets in the liver and muscle of three NOD, three HFD and three DIO were determined using the ImageJ software. Values are means ± SEM. *, p < 0.05. **, p < 0.01. |
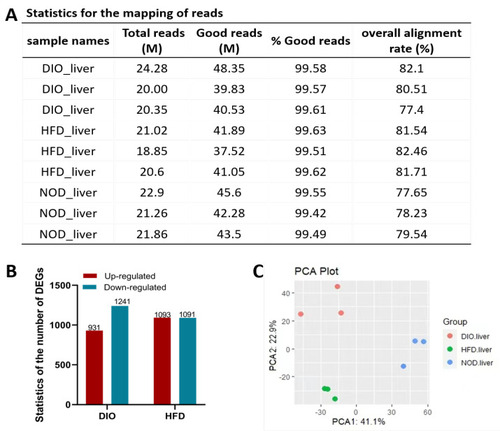
Identification of DEGs induced by HFD and DIO in zebrafish. (A) Statistics for the mapping of reads in three groups. (B) The number of DEGs between groups of different diets (fold change ≥ 1.5 and p-value ≤ 0.05). (C) The principal component analysis (PCA) of differentially expressed genes in three groups. |
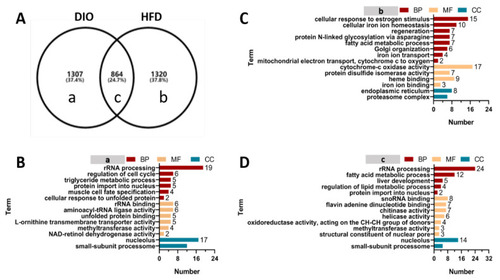
GO enrichment analysis of DEGs in (a), (b) and (c) groups. ( GO enrichment analysis of DEGs in (a), (b) and (c) groups. (A) Venn diagram analysis of differentially expressed genes. a–c: different letters represent genes specifically expressed in different Venn groups. (B) GO enrichment analysis of genes specifically expressed in group (a) that represent a class of genes specifically expressed in DIO zebrafish. (C) GO enrichment analysis of genes specifically expressed in group (b) that represent a class of genes specifically expressed in HFD zebrafish. (D) GO enrichment analysis of genes specifically expressed in group (c) that represent a class of genes shared in DIO and HFD zebrafish. |
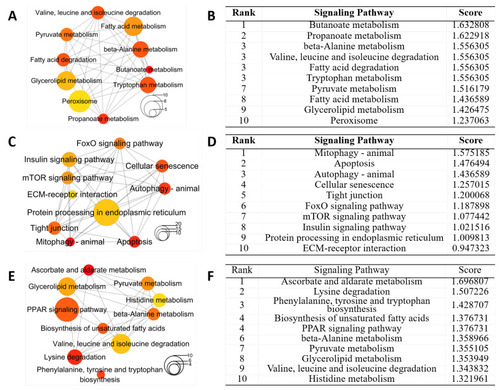
Hub signaling pathways from KEGG enrichment analysis of DEGs in livers for different groups. Networks of top 10 hub pathways (A) and top 10 hub pathways ranked by DMNC method (B) for DEGs in group (a). Networks of top 10 hub pathways (C) and top 10 hub pathways ranked by DMNC method (D) for DEGs in group (b). Networks of top10 hub pathways (E) and top 10 hub pathways ranked by DMNC method (F) for DEGs in group (c). Node color and size stand for the enrichment p-value and the number of genes in the pathway, respectively. |
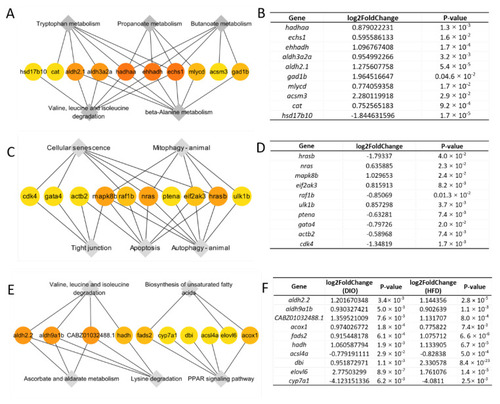
Hub genes within KEGG pathways. (A) Networks of 10 hub genes mapped to top 5 pathways in group (a). (B) The fold changes of hub genes in group (a). (C) Networks of 10 hub genes mapped to top 5 pathways in group (b). (D) The fold changes of hub genes in group (b). (E) Networks of 10 hub genes mapped to top 5 pathways in group (c). (F) The fold changes of hub genes in group (c). |