
Image
|
Figure Caption
Figure 1
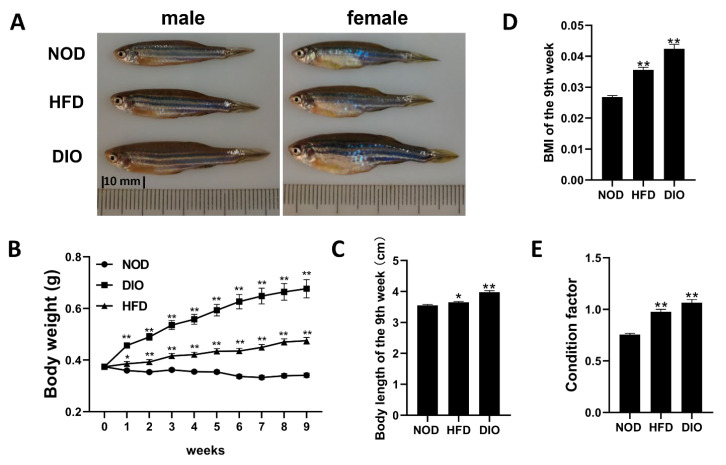
Both HFD and DIO induced obese phenotypes in zebrafish. (A) Lateral views of NOD, DIO and HFD zebrafish after 9 weeks of feeding. The distance between two dashes is 10 mm. (B) Changes in body weight during 9-week feeding experiments. (C) Changes in body length after 9 weeks of feeding. (D) Changes in BMI after 9 weeks of feeding. (E) Changes in condition factor after 9 weeks of feeding. *, p < 0.05, **, p < 0.01. Values are means ± SEM. Each group has 60 fish.
Acknowledgments
This image is the copyrighted work of the attributed author or publisher, and
ZFIN has permission only to display this image to its users.
Additional permissions should be obtained from the applicable author or publisher of the image.
Full text @ Int. J. Mol. Sci.