
Figure 5
- ID
- ZDB-FIG-230217-173
- Publication
- Li et al., 2023 - Effects of Nutritionally Induced Obesity on Metabolic Pathways of Zebrafish
- Other Figures
- All Figure Page
- Back to All Figure Page
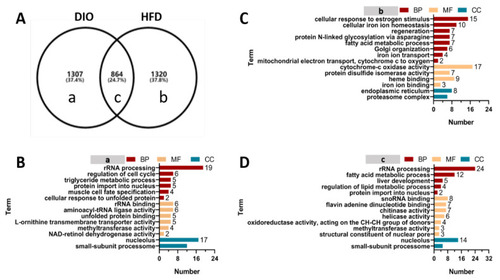
GO enrichment analysis of DEGs in (a), (b) and (c) groups. ( GO enrichment analysis of DEGs in (a), (b) and (c) groups. (A) Venn diagram analysis of differentially expressed genes. a–c: different letters represent genes specifically expressed in different Venn groups. (B) GO enrichment analysis of genes specifically expressed in group (a) that represent a class of genes specifically expressed in DIO zebrafish. (C) GO enrichment analysis of genes specifically expressed in group (b) that represent a class of genes specifically expressed in HFD zebrafish. (D) GO enrichment analysis of genes specifically expressed in group (c) that represent a class of genes shared in DIO and HFD zebrafish. |