
Image
|
Figure Caption
Figure 2
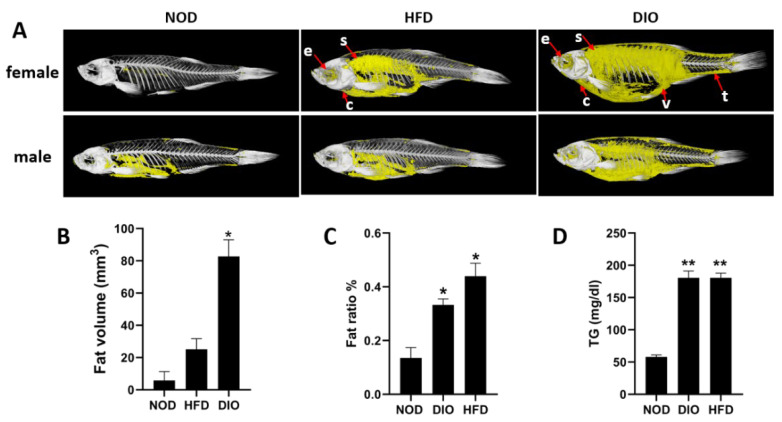
Lipid accumulation and fat distribution in three groups. (A) The in vivo micro-CT scans of zebrafish. Each group measures 4 fish, including 2 females and 2 males. Yellow: adipose tissue; white: bone; e: eyes; s: subcutaneous; c: heart; v: viscera; t: tail. (B) Quantitative analysis of the fat volume. Each group measures 4 fish, including 2 females and 2 males. Values are means ± SEM. (C) Total lipid content of whole fish. (D) Plasma TG levels. *, p < 0.05, **, p < 0.01. Values are means ± SEM. n = 4 for each group.
Acknowledgments
This image is the copyrighted work of the attributed author or publisher, and
ZFIN has permission only to display this image to its users.
Additional permissions should be obtained from the applicable author or publisher of the image.
Full text @ Int. J. Mol. Sci.