
- Title
-
Zebrafish Tric-b is required for skeletal development and bone cells differentiation
- Authors
- Tonelli, F., Leoni, L., Daponte, V., Gioia, R., Cotti, S., Fiedler, I.A.K., Larianova, D., Willaert, A., Coucke, P.J., Villani, S., Busse, B., Besio, R., Rossi, A., Witten, P.E., Forlino, A.
- Source
- Full text @ Front Endocrinol (Lausanne)
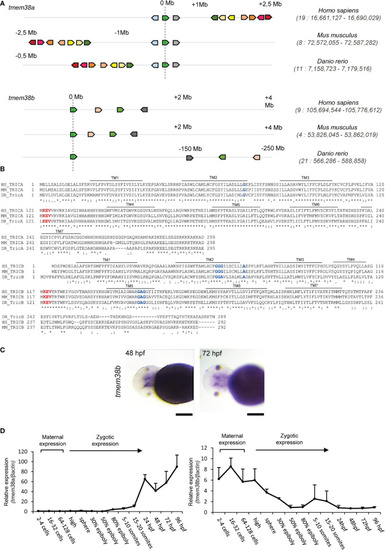
Analysis of tmem38a/b across species and of their spatio-temporal expression during zebrafish development. (A) The sinteny analysis performed on humans (H. sapiens), mice (M. musculus) and zebrafish (D. rerio) supported the existence of a common ancestral chromosomal origin for both tmem38a and tmem38b. The maps were obtained using the genome browser Genomicus. The human genes were used as roots. The position of the genes (Mb) relative to the investigated locus is based on Ensemble database and shown on top of the chromosome line. The exact chromosomal position of all the conserved genes is reported in the Supplementary Tables S1. The direction of the arrows indicates the gene orientation in respect to the reference gene. (B) Trimeric intracellular cation channel A (TRIC-A) and B (TRIC-B) domains are conserved among human, mouse and zebrafish. The 7 transmembrane domains (TM) are indicated. In red is shown the KEV pore channel domain, while in blue are indicated the two glycine reach regions in TM2 and TM5. (C) In situ hybridization analysis of 48 and 72 hpf WT embryos revealed the presence of tmem38b in the region of craniofacial cartilages. (D) Relative expression of tmem38a and tmem38b was evaluated by qPCR demonstrating a maternal expression only for tmem38b. The experiment was perfomed in duplicate. Scale bar: 500 µm. Human TMEM38A ENSG00000072954, murine Tmem38a ENSMUSG00000031791, zebrafish tmem38a ENSDARG00000024047; human TMEM38B ENSG00000095209, murine Tmem38b ENSMUSG00000028420, zebrafish tmem38b ENSDARG00000100549. Tric-a: human Q9H6F2, murine Q3PMT8, zebrafish Q6P2T0; Tric-b: human Q9NVV0, murine Q9DAV9, zebrafish Q7ZVP8. |
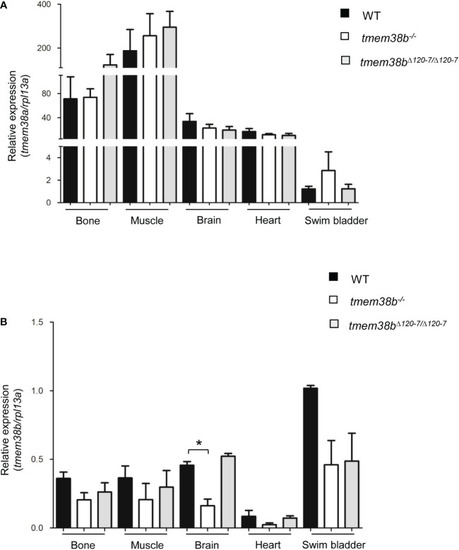
Expression analysis of tmem38a and tmem38b in excitable (muscle, brain, heart) and non-excitable tissues (bone, swim bladder) from adult WT and tmem38b mutants. (A) Relative expression of tmem38a. No difference in the transcript level was found between WT and tmem38b mutants by qPCR. (B) Relative expression of tmem38b. qPCR analysis revealed a reduced transcript level in almost all tmem38b-/- tissues respect to WT. Data are expressed as mean ± SEM. *p < 0.05 n = 3 RNA pools per group. |
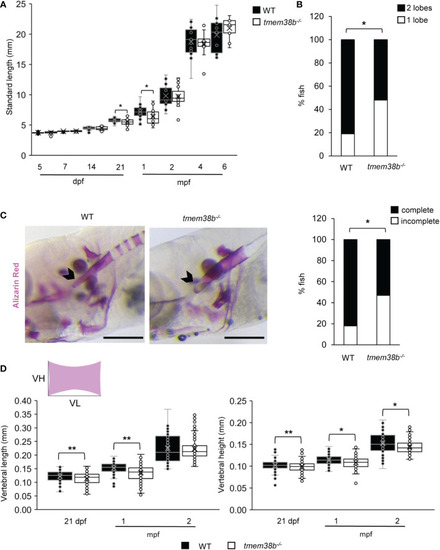
tmem38b-/- skeletal phenotype. (A) Growth curves representing WT and tmem38b-/- standard length measured at 5, 7, 14, 21 dpf, 1, 2, 4 and 6 mpf. At 21 dpf and 1 mpf tmem38b-/- were significantly shorter than WT. WT n ≥ 13, tmem38b-/- n ≥ 8. (B) At 21 dpf a significant delay in the inflation of the swim bladder was observed in tmem38b-/- (n = 27) with respect to WT (n = 28). (C) Representative lateral view (left panels) of 14 dpf alizarin red stained WT and tmem38b-/- fish. The notochord is indicated by the arrowhead. On the right the graph represents the level of the tip of the notochord mineralization, a delayed mineralization was evident in tmem38b-/- (tmem38b-/- n = 17) respect to WT (WT n = 28) Scale bar: 500 µm. (D) Vertebral length and vertebral height measurement in WT and tmem38b-/- zebrafish. Vertebral length (VL) was reduced in tmem38b-/- compared to WT at 21 dpf and 1 mpf. Vertebral height (VH) was reduced in tmem38b-/- compared to WT at 21 dpf, 1 and 2 mpf. 21 dpf: WT n= 29; tmem38b-/- n= 25; 1 mpf: WT n= 24; tmem38b-/- n= 18; 2 mpf: WT n= 13; tmem38b-/- n= 14. *,p < 0.05, **p ≤ 0.01. |
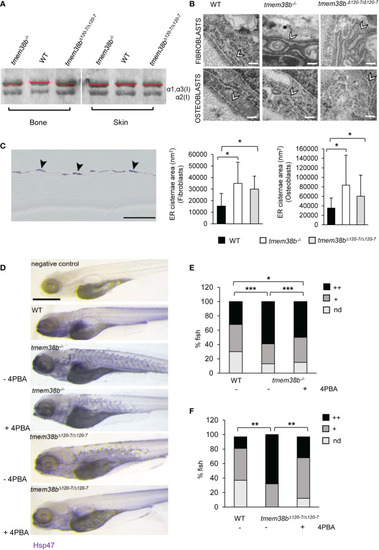
Collagen type I and ultrastructural analysis. (A) Representative Coomassie stained SDS-Urea-PAGE of collagen type I extracted from WT (n = 2) and mutants (tmem38b-/- n = 2; tmem38bΔ120-7/Δ120-7 n = 2) bone and skin. Mutants’ collagen α bands presented a slight faster migration compared to WT as highlighted by red lines. (B) Transmission electron microscopy images of 1 mpf WT (n = 3), tmem38b-/- (n = 3), and tmem38bΔ120-7/Δ120-7 (n = 3) fibroblasts and osteoblasts at the vertebral endplate. ER cisternae enlargement was evident in mutants (arrowheads). Magnification 80000x. Scale bar: 200 nm. The ER cisternae area quantitation is shown in the graphs (bottom). (C) Immunohistochemistry of 5 dpf WT and tmem38b-/- with Hsp47b antibody. High magnification details of the skin of WT and tmem38b-/- following immunostaining with Hsp47b antibody revaled that Hsp47 signal was located in the fibroblasts of the skin (arrowheads). (D) Representative images of 5 dpf fish after whole mount immunohistochemistry with Hsp47b antibody, before and after 4PBA administration. Scale bar: 500 μm. (E) Analysis of Hsp47b expression by whole mount immunohistochemistry in WT and in tmem38b-/- before and after 4PBA administration. A significant increase of Hsp47 signal was detected in tmem38-/- compared to WT. 4PBA treatment significantly reduced the Hsp47b signal in tmem38b-/- compared to untreated mutant fish without reaching WT value (WT n = 146 and tmem38b-/- n = 116 untreated and 4PBA treated tmem38b-/- n = 113). (F) Analysis of Hsp47b expression by whole mount immunohistochemistry in WT and in tmem38bΔ120-7/Δ120-7 before and after 4PBA administration. A significant increase of Hsp47 signal was present in tmem38bΔ120-7/Δ120-7 compared to WT. 4PBA treatment significantly reduced the Hsp47b signal in tmem38bΔ120-7/Δ120-7 compared to untreated mutant fish reaching WT value (WT n = 43 and tmem38bΔ120-7/Δ120-7 n = 19 untreated and 4PBA treated tmem38bΔ120-7/Δ120-7 n = 34). Zero (nd), low (+) and high (++) indicate the intensity of the signal. *p < 0.05, **p ≤ 0.01, ***p ≤ 0.001. |
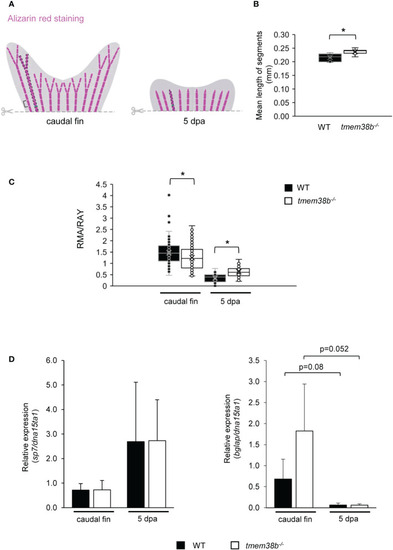
Morphometric and bone mineralization analyses during caudal fin regeneration in WT and tmem38b-/- mutants. (A) Schematic representation of morphometric measurements. Brackets indicate the length of fin ray segment, dashed areas represent the real mineralized areas (RMA) and the green lines indicate the ray widths (RAY). (B) The mean length of caudal fin ray segments was evaluated. Segments were significantly longer in tmem38b-/- compared to WT. (C) The ratio between the real mineralized area (RMA) and the mean ray width (RAY) was measured on alizarin red stained caudal fins to assess mineralization level. tmem38b-/- caudal fin was less mineralized respect to the WT. After 5 dpa, the regenerated mineralized area was larger in tmem38b-/- respect to the WT (WT n ≥ 9, tmem38b-/- n ≥ 8) *p < 0.05. (D) Relative expression of the early (sp7) and late (bglap) osteoblastic markers in WT and tmem38b-/- caudal fins in amputated and 5 dpa (WT n = 3, tmem38b-/- n = 3) samples. No significant difference was detected in sp7 and bglap expression between WT and tmem38b-/- at both time points, even if a trend towards higher value was evident for bglap in mutant caudal fins with respect to controls. Data are shown as mean ± SEM. |
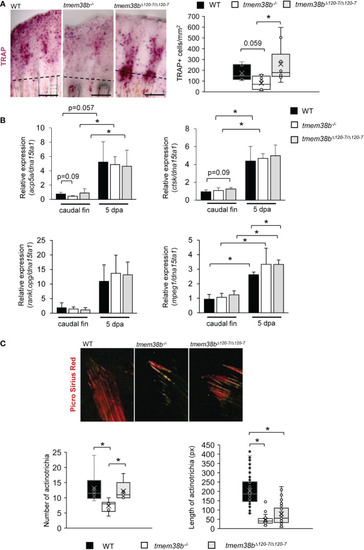
Osteoclast analysis during caudal fin regeneration in tmem38b mutants. (A) Representative images of TRAP staining of caudal fins of WT and tmem38b mutants at 5 dpa (WT n = 7, tmem38b-/- n = 9, tmem38bΔ120-7/Δ120-7 n = 10). In WT, osteoclasts were present in the regenerate. Almost no TRAP activity could be detected in tmem38b-/- , while in tmem38bΔ120-7/Δ120-7 it seemed to be mostly localized along the regenerating fin rays. TRAP+ cells were significantly reduced in tmem38b-/- respect to the other two groups. (B) Relative expression of bone resorption-related markers acp5a and ctsk, of the macrophage marker mpeg1 and rankl/opg ratio in amputated and 5 dpa caudal fin (WT n = 3, tmem38b-/- n = 3, tmem38bΔ120-7/Δ120-7 n = 3). All markers were increased after amputation. mpeg1 was significantly overexpressed in tmem38bΔ120-7/Δ120-7 compared to WT at 5 dpa.*: p < 0.05. (C) Representative images of picro sirius red staining of actinotrichia in caudal fins of WT and tmem38b mutants (WT n = 3, tmem38b-/- n = 3, tmem38bΔ120-7/Δ120-7 n = 3). tmem38b-/- revealed a reduced number of actinotrichia respect to WT and tmem38bΔ120-7/Δ120-7 , while the length of actinotrichia was reduced in both mutants compared to WT. *p < 0.05. |