
|
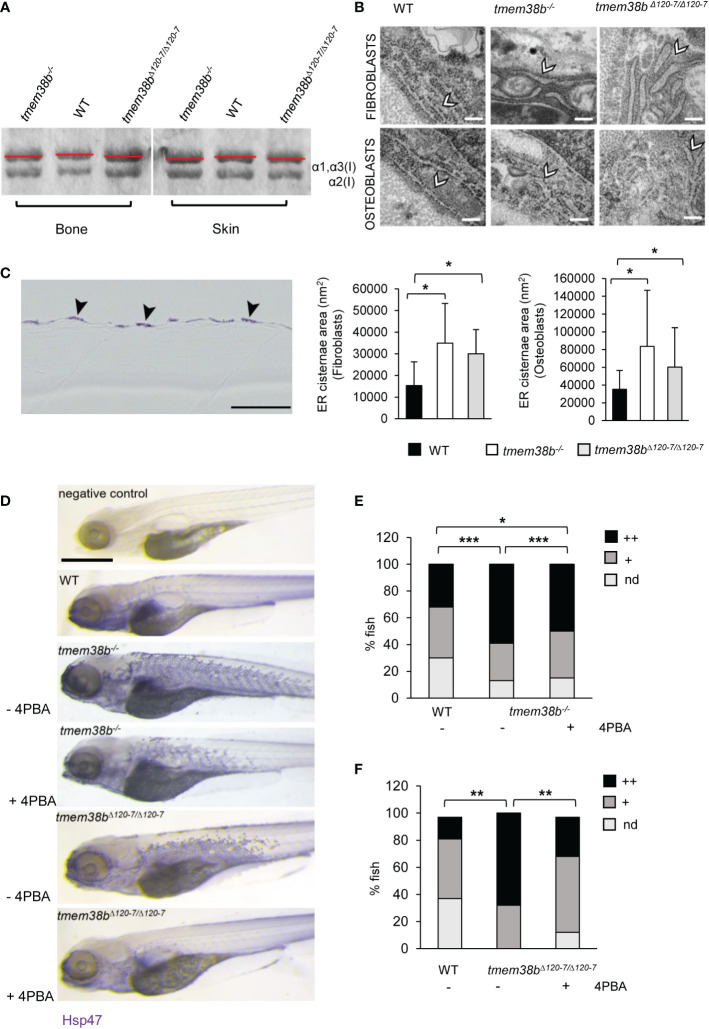
Figure 4
Collagen type I and ultrastructural analysis. (A) Representative Coomassie stained SDS-Urea-PAGE of collagen type I extracted from WT (n = 2) and mutants (tmem38b-/- n = 2; tmem38bΔ120-7/Δ120-7 n = 2) bone and skin. Mutants’ collagen α bands presented a slight faster migration compared to WT as highlighted by red lines. (B) Transmission electron microscopy images of 1 mpf WT (n = 3), tmem38b-/- (n = 3), and tmem38bΔ120-7/Δ120-7 (n = 3) fibroblasts and osteoblasts at the vertebral endplate. ER cisternae enlargement was evident in mutants (arrowheads). Magnification 80000x. Scale bar: 200 nm. The ER cisternae area quantitation is shown in the graphs (bottom). (C) Immunohistochemistry of 5 dpf WT and tmem38b-/- with Hsp47b antibody. High magnification details of the skin of WT and tmem38b-/- following immunostaining with Hsp47b antibody revaled that Hsp47 signal was located in the fibroblasts of the skin (arrowheads). (D) Representative images of 5 dpf fish after whole mount immunohistochemistry with Hsp47b antibody, before and after 4PBA administration. Scale bar: 500 μm. (E) Analysis of Hsp47b expression by whole mount immunohistochemistry in WT and in tmem38b-/- before and after 4PBA administration. A significant increase of Hsp47 signal was detected in tmem38-/- compared to WT. 4PBA treatment significantly reduced the Hsp47b signal in tmem38b-/- compared to untreated mutant fish without reaching WT value (WT n = 146 and tmem38b-/- n = 116 untreated and 4PBA treated tmem38b-/- n = 113). (F) Analysis of Hsp47b expression by whole mount immunohistochemistry in WT and in tmem38bΔ120-7/Δ120-7 before and after 4PBA administration. A significant increase of Hsp47 signal was present in tmem38bΔ120-7/Δ120-7 compared to WT. 4PBA treatment significantly reduced the Hsp47b signal in tmem38bΔ120-7/Δ120-7 compared to untreated mutant fish reaching WT value (WT n = 43 and tmem38bΔ120-7/Δ120-7 n = 19 untreated and 4PBA treated tmem38bΔ120-7/Δ120-7 n = 34). Zero (nd), low (+) and high (++) indicate the intensity of the signal. *p < 0.05, **p ≤ 0.01, ***p ≤ 0.001.