
|
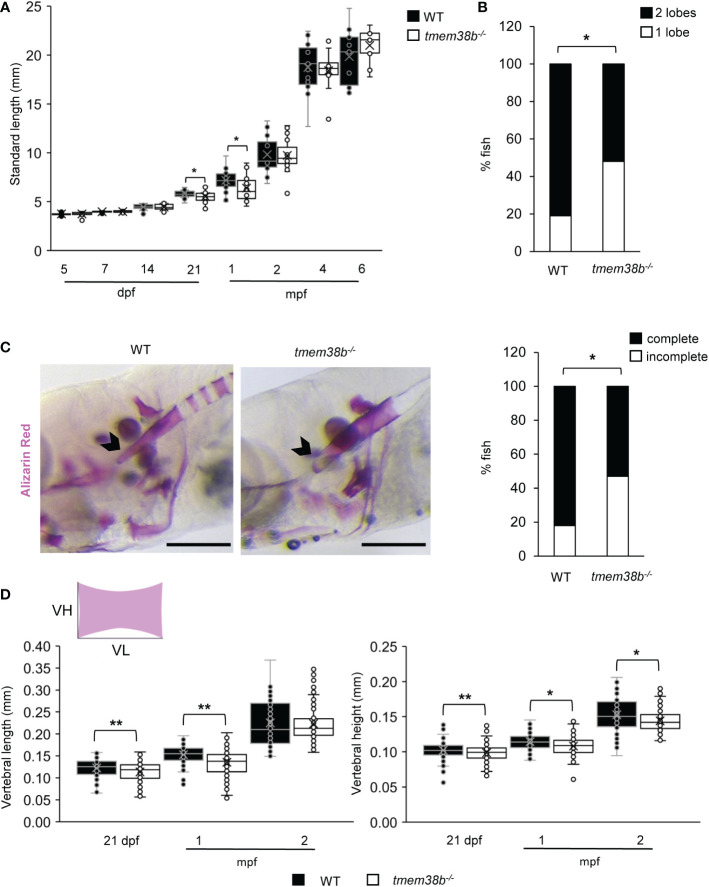
Figure 3
tmem38b-/- skeletal phenotype. (A) Growth curves representing WT and tmem38b-/- standard length measured at 5, 7, 14, 21 dpf, 1, 2, 4 and 6 mpf. At 21 dpf and 1 mpf tmem38b-/- were significantly shorter than WT. WT n ≥ 13, tmem38b-/- n ≥ 8. (B) At 21 dpf a significant delay in the inflation of the swim bladder was observed in tmem38b-/- (n = 27) with respect to WT (n = 28). (C) Representative lateral view (left panels) of 14 dpf alizarin red stained WT and tmem38b-/- fish. The notochord is indicated by the arrowhead. On the right the graph represents the level of the tip of the notochord mineralization, a delayed mineralization was evident in tmem38b-/- (tmem38b-/- n = 17) respect to WT (WT n = 28) Scale bar: 500 µm. (D) Vertebral length and vertebral height measurement in WT and tmem38b-/- zebrafish. Vertebral length (VL) was reduced in tmem38b-/- compared to WT at 21 dpf and 1 mpf. Vertebral height (VH) was reduced in tmem38b-/- compared to WT at 21 dpf, 1 and 2 mpf. 21 dpf: WT n= 29; tmem38b-/- n= 25; 1 mpf: WT n= 24; tmem38b-/- n= 18; 2 mpf: WT n= 13; tmem38b-/- n= 14. *,p < 0.05, **p ≤ 0.01.