
Image
|
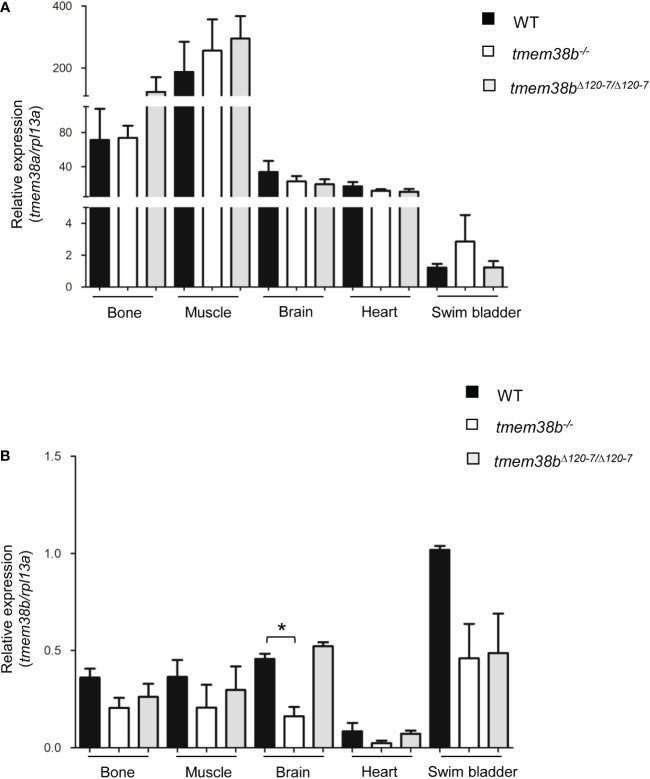
Figure Caption
Figure 2
Expression analysis of tmem38a and tmem38b in excitable (muscle, brain, heart) and non-excitable tissues (bone, swim bladder) from adult WT and tmem38b mutants. (A) Relative expression of tmem38a. No difference in the transcript level was found between WT and tmem38b mutants by qPCR. (B) Relative expression of tmem38b. qPCR analysis revealed a reduced transcript level in almost all tmem38b-/- tissues respect to WT. Data are expressed as mean ± SEM. *p < 0.05 n = 3 RNA pools per group.
Figure Data
Acknowledgments
This image is the copyrighted work of the attributed author or publisher, and
ZFIN has permission only to display this image to its users.
Additional permissions should be obtained from the applicable author or publisher of the image.
Full text @ Front Endocrinol (Lausanne)