
|
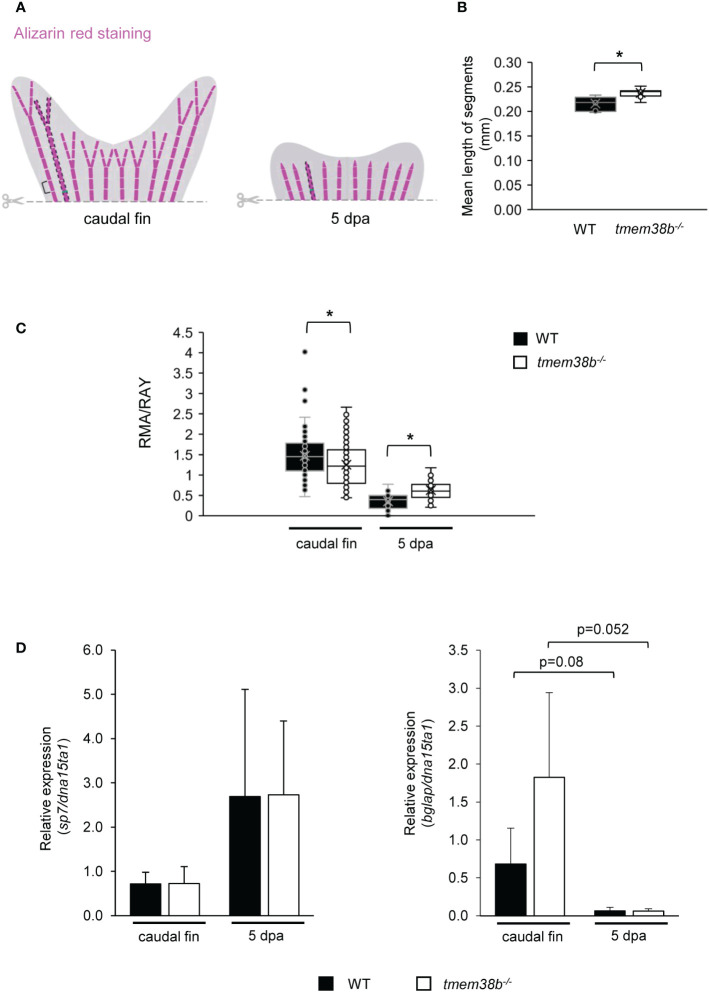
Figure 5
Morphometric and bone mineralization analyses during caudal fin regeneration in WT and tmem38b-/- mutants. (A) Schematic representation of morphometric measurements. Brackets indicate the length of fin ray segment, dashed areas represent the real mineralized areas (RMA) and the green lines indicate the ray widths (RAY). (B) The mean length of caudal fin ray segments was evaluated. Segments were significantly longer in tmem38b-/- compared to WT. (C) The ratio between the real mineralized area (RMA) and the mean ray width (RAY) was measured on alizarin red stained caudal fins to assess mineralization level. tmem38b-/- caudal fin was less mineralized respect to the WT. After 5 dpa, the regenerated mineralized area was larger in tmem38b-/- respect to the WT (WT n ≥ 9, tmem38b-/- n ≥ 8) *p < 0.05. (D) Relative expression of the early (sp7) and late (bglap) osteoblastic markers in WT and tmem38b-/- caudal fins in amputated and 5 dpa (WT n = 3, tmem38b-/- n = 3) samples. No significant difference was detected in sp7 and bglap expression between WT and tmem38b-/- at both time points, even if a trend towards higher value was evident for bglap in mutant caudal fins with respect to controls. Data are shown as mean ± SEM.