
- Title
-
Rapid and reversible optogenetic silencing of synaptic transmission by clustering of synaptic vesicles
- Authors
- Vettkötter, D., Schneider, M., Goulden, B.D., Dill, H., Liewald, J., Zeiler, S., Guldan, J., Ateş, Y.A., Watanabe, S., Gottschalk, A.
- Source
- Full text @ Nat. Commun.
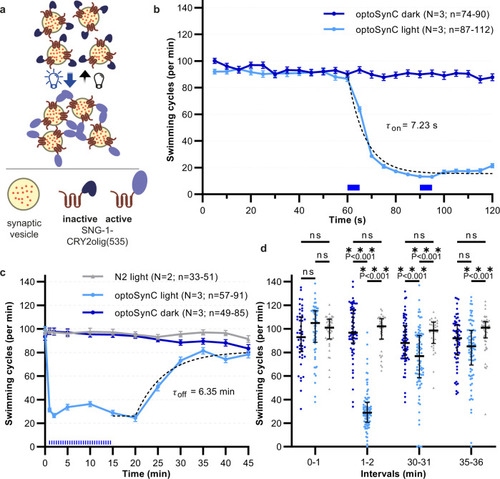
OptoSynC inhibits behavior within seconds and recovers within minutes in the dark.
a Schematic illustrating SV clustering through homo-oligomerization of CRY2olig(535) upon blue light illumination. b Mean (±s.e.m.) swimming cycles of worms expressing optoSynC pan-neuronally. Illumination (470 nm, 0.1 mW/mm², 5 s / 25 s ISI) is indicated by blue rectangles; dotted line: one-phase decay fit (60 –120 s). c As in b, longer time course. Sustained inhibition of swimming by ongoing light pulses, and recovery in the dark. Dotted line: ‘plateau followed by one phase association’-fit. N2 – non-transgenic wild type. d Group data (speed of individual animals, median + inter-quartile range) before (0–1 min), during (1–2 min), and after (30–31; 35–36 min) blue illumination. Two-way ANOVA with Bonferroni correction between light and dark measurements of wild type and optoSynC expressing animals (sng-1(ok234) background); ***p < 0.001; ns – non-significant. Number of individual animals (n) from left to right: 44, 57, 49, 42, 91, 64, 33, 85, 65, 51, 82, 63; across N = 2 (wild type) and N = 3 (optoSynC) independent experiments with animals picked from independent populations; range of individual animals across each measured time point and over N independent experiments is indicated for b and c. |
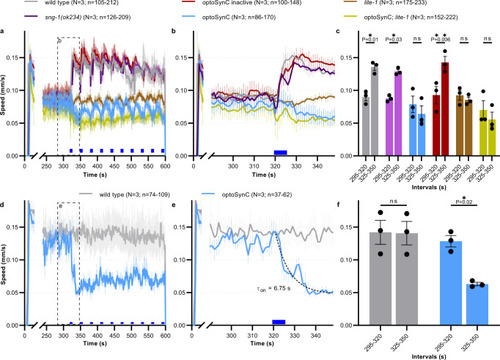
Immediate inhibition of the LITE-1-dependent escape response by optoSynC.
a Mean ± s.e.m crawling speed analysis, blue light application (470 nm, 1 mW/mm², 5 s / 25 s ISI, indicated by blue rectangles), genotypes as indicated (optoSynC expressing animals are in sng-1(ok234) background). b Close-up of box indicated in a. c Group data, mean crawling speed of animals tested in N = 3 independent experiments (±s.e.m), analyzed as mean of time intervals before (295–320 s), and after (325–350 s) first light pulse; number of independent animals (n) across all independent experiments (N, i.e. animals picked from N independent populations) is indicated as range. d As in a, but using only 0.1 mW/mm² stimuli. e Close-up of box indicated in d. Dotted line represents one phase decay fit. f As in c, for data in d. In c, f, data are statistically analyzed with two-way ANOVA, Bonferroni correction, ns not significant. |
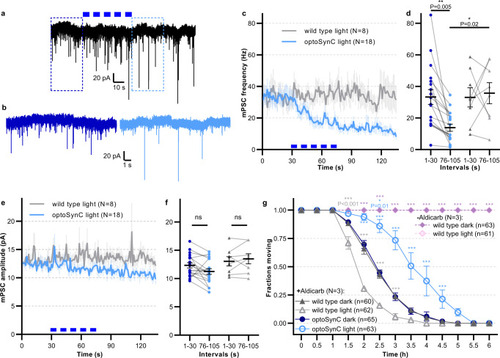
optoSynC activation reduces miniature post-synaptic current (mPSC) rate at the neuromuscular junction (NMJ) and can block cholinergic transmission for hours.
a Representative postsynaptic current traces recorded in body wall muscle cells of optoSynC-expressing animals; blue light pulses (470 nm, 8 mW/mm², 5 s / 5 s ISI) indicated by blue rectangles. b Close-up of regions indicated in a, before (0–10 s, dark blue) and after (95–105 s, light blue) blue light illumination. c Mean (±s.e.m.) mPSC frequency with blue light illumination of wild type and optoSynC expressing animals. d Group analysis of data (mean ± s.e.m.) in c, intervals before (0–30 s) and after (76–105 s) illumination. Number of independent animals is n = 8 (wild type) and n = 18 (optoSynC). e, f Analysis of mPSC amplitude (mean ± s.e.m.), as in c, d. g Paralysis of animals in response to 2 (or 0) mM aldicarb under continuous blue light illumination (470 nm, 0.05 mW/mm²), or in the dark, as indicated (mean ± s.e.m.). Two-way ANOVA with Bonferroni correction of the indicated number of animals (in b–f), or of N = 3 experiments averaged at the indicated time points with n independent animals as indicated (in g). ***p < 0.001, ns not significant. |
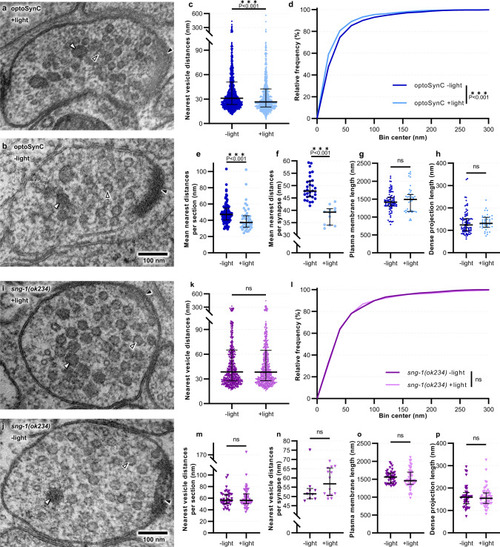
optoSynC activation causes clustering of SVs at the ultrastructural level.
a, b Transmission electron micrographs of representative cholinergic synapses from animals illuminated for 5 s (a, +light) with blue light (470 nm, 0.1 mW/mm²), or kept in darkness (b, −light) before high-pressure freezing. SVs (open black arrowheads), dense core vesicles (DCVs, white closed arrowheads), and dense projection (DP, closed black arrowheads) are indicated. c Distance analysis of nearest vesicles for each analyzed cholinergic micrograph; −light (n = 1473), +light (n = 819). d Relative frequency distribution of nearest vesicle distances shown in c. e Mean nearest distances per section; −light (n = 88), +light (n = 43). f Mean nearest distances per synapse; −light (n = 30), +light (n = 12). g, h Lengths of the PM and DP, respectively; −light (n = 88), +light (n = 43). Data in c, e–h are shown as median with 75–25% interquartile range (IQR). i–p, As for a–h, respectively, but for non-transgenic sng-1(ok234) mutant animals (n = 707, 41, 9 for −light, and 733, 40, 14 for +light; in k, n, l, o, m, p, respectively. Sections originated from two animals, and 9–30 synapses for each condition. Statistical test used: Mann–Whitney (two-tailed) in c, e, g–h, k, m–p; unpaired t-test (two-tailed) in f; Kolmogorov–Smirnov in d, l; ***p < 0.001, ns not significant. |
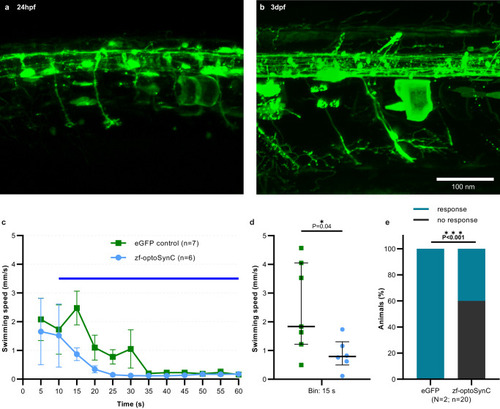
zf-optoSynC activation in zebrafish neurons blocks escape behavior.
a, b Pan-neuronal expression of eGFP in neurons of zebrafish larvae at the indicated developmental stages. Representative images show transient expression in Tg(elavl3.2:Gal4-VP16)mde4 animals injected with UAS:zf-optoSynC (n = 2 independent experiments). c Swimming behavior, triggered by continuous blue light (blue bar), in 4 dpf larvae expressing the respective transgene, as indicated. Mean ± s.e.m., numbers of individual animals are indicated. d Statistical analysis of data in c, as median and 75–25% IQR. Number of independent animals n = 7 (eGFP) and n = 6 (zf-optoSynC). e Touch response of 3 dpf larvae during blue light-induced zf-optoSynC/CRY2olig(535) clustering. Two experiments, number of animals is indicated. Unpaired Student’s t test (two-tailed) in d, and Fisher’s exact test (two-sided) in e. |
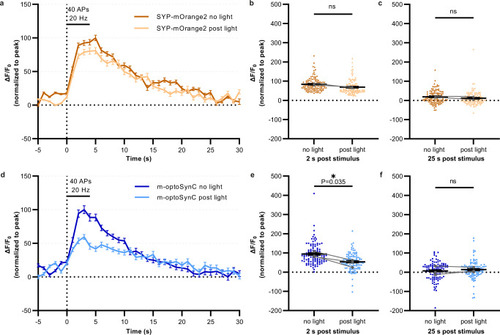
m-optoSynC activation in murine hippocampal neurons blocks synaptic transmission.
a Plot showing changes in normalized fluorescence intensity of mOrange2 by electrical field stimulation of neurons expressing mOrange2-SYP before (black line) and after 488 nm illumination for 30 s (green line). N = 2 independent cultures. n = 5 neurons and 116 synapses. b, c Normalized fluorescence intensity at 2 s or 25 s after electrical stimulation. Paired t-test. d–f Same as a-c, respectively, but in neurons expressing m-optoSynC (CRY2olig(535) inserted into SYP-mOrange2. Paired t-test. N = 3 independent cultures. n = 10 neurons, and 108 synapses. ns = not significant. *<0.05. |
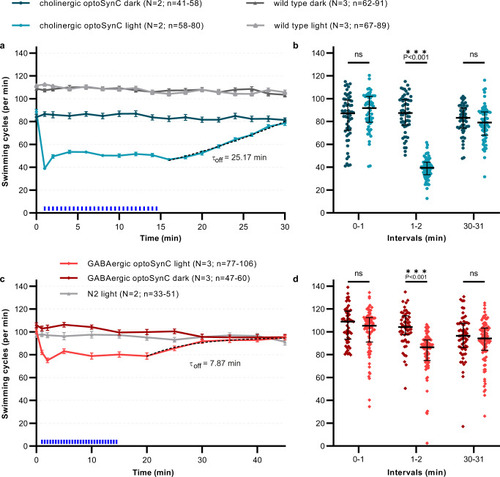
Cell-specific optoSynC inhibition of cholinergic and GABAergic neurons.
a Swimming behavior in animals expressing optoSynC in cholinergic neurons. Blue light activation (470 nm, 0.1 mW/mm², 5 s/25 s ISI) indicated by blue rectangles. Dotted line: ‘plateau followed by one phase association’-fit. Error bars are s.e.m. Number of individual animals (n) across independent experiments (N, i.e. animals picked from N independent populations) is indicated as range. b Swimming cycles of individual animals, median and 25–75 % IQR of N = 2–3 experiments analyzed in time intervals before (0–1 min), during (1–2 min), and after (30–31 min) blue light illumination; number of individual animals (n) across all experiments from left to right: 58, 58, 57, 72, 53, 64. Two-way ANOVA with Bonferroni correction between light and dark measurements of wild type and cholinergic optoSynC expressing strains; ***p < 0.001. c, d as for a, b, but optoSynC was expressed in GABAergic neurons. Number of individual animals (n) from left to right: 77, 55, 86, 56, 98, 60. |
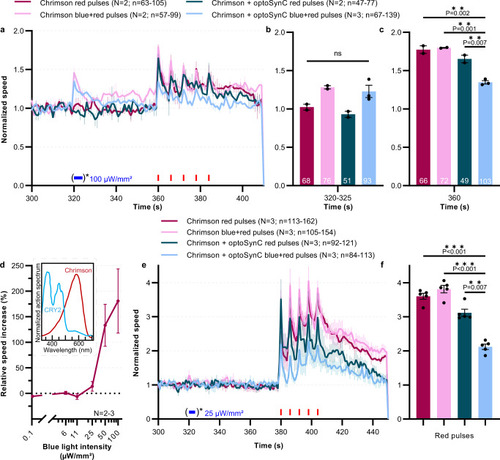
Expression of optoSynC in the single nociceptive neuron PVD attenuates PVD::Chrimson-evoked velocity increase.
a Mean ± s.e.m. normalized crawling speed of animals expressing Chrimson, or Chrimson and optoSynC in the PVD neuron. Red light stimulation (680 nm, 0.1 mW/mm², 1 s/5 s ISI) is indicated by red rectangles, activation of optoSynC with blue light (470 nm, 0.1 mW/mm², 5 s) by a blue rectangle and asterisk. Data acquisition started at 0 s, but animals are left to accommodate before starting the experiment. b Group data, mean crawling speed of N = 2–3 independent experiments (±s.e.m) analyzed during time intervals with (or without) blue pulse (320–325 s). Number of independent animals (n) across all independent experiments (N, i.e. animals picked from N independent populations) is indicated as range. c As in b, but during first red light pulse (360 s). d Light intensity titration of blue light responses of PVD::Chrimson animals (mean ± s.e.m.; 61–147 individual animals, across N = 2–3 independent experiments, were analyzed). Inset: Spectral overlap of CRY2 and Chrimson, derived from refs. 44,81. e As in a, but with only 25 µW/mm² optoSynC activation, avoiding optical crosstalk with Chrimson. f as in c, but during peaks of red pulses (380 s, 386 s, 392 s, 398 s, 404 s), for data in e. In b, c, f: one-way ANOVA with Bonferroni correction; ns non-significant. Number of independent experiments (N) and individual animals (n) is indicated. |
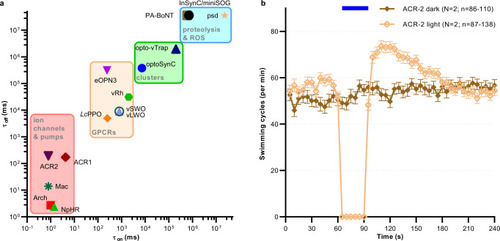
Comparison of tools for optogenetic silencing of synaptic transmission.
a Matrix showing time constants (activity on- and offset) of optogenetic tools for synaptic inhibition. Tools are grouped by their molecular nature/mechanism of action. Data was derived from refs. 13,18,19,22–24,27,28,30,38,82,83b ACR2 expressed in C. elegans cholinergic motor neurons evokes rapid and complete inhibition of locomotion, associated with sustained after-effects. Mean (±s.e.m.) swimming cycles of animals expressing ACR2. Number of individual animals (n) across each measured time point and across N = 2 independent experiments (animals picked from N independent populations) is indicated as range. |