
FIGURE
Fig. 6
Fig. 6
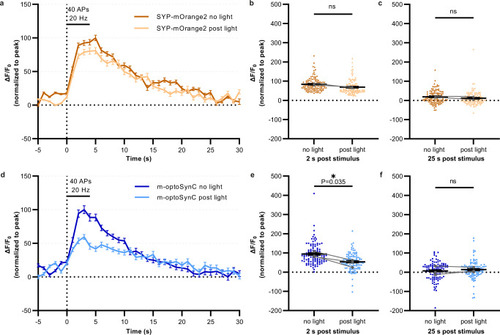
m-optoSynC activation in murine hippocampal neurons blocks synaptic transmission.
a Plot showing changes in normalized fluorescence intensity of mOrange2 by electrical field stimulation of neurons expressing mOrange2-SYP before (black line) and after 488 nm illumination for 30 s (green line). N = 2 independent cultures. n = 5 neurons and 116 synapses. b, c Normalized fluorescence intensity at 2 s or 25 s after electrical stimulation. Paired t-test. d–f Same as a-c, respectively, but in neurons expressing m-optoSynC (CRY2olig(535) inserted into SYP-mOrange2. Paired t-test. N = 3 independent cultures. n = 10 neurons, and 108 synapses. ns = not significant. *<0.05. |
Expression Data
Expression Detail
Antibody Labeling
Phenotype Data
Phenotype Detail
Acknowledgments
This image is the copyrighted work of the attributed author or publisher, and
ZFIN has permission only to display this image to its users.
Additional permissions should be obtained from the applicable author or publisher of the image.
Full text @ Nat. Commun.